Navigating Market Volatility, Tariffs and Recessionary Signals
Words: 1,377 Time: 6 Minutes
- Mean Reversion: The S&P 500 finds a floor at the 200-week moving average.
- Policy vs. Price: How market pain forced a shift in Washington"s rhetoric.
- Valuation Limits: Why 5,700 represents a significant fundamental ceiling for stocks.
After a brief hiatus, I am returning to the desk. While market commentary was temporarily traded for travel and the golf course, the underlying mechanics of the S&P 500 have played out with striking technical precision.
Looking back four weeks, we saw a "perfect storm" of negative drivers—a combination of aggressive tariff threats and extreme negative sentiment—which pushed the VIX above 45x. For the disciplined investor, such spikes in panic rarely signal a time to exit; rather, they represent an emotional reaction to short-term fear by the herd, creating a window to acquire quality assets at a discount.
On March 31, I identified the 4600 to 5000 zone as a high-probability "initial" buy zone for those with reserve capital (ref: "Trump Dump Offers Opportunity"). Here is the weekly chart shared at that time:
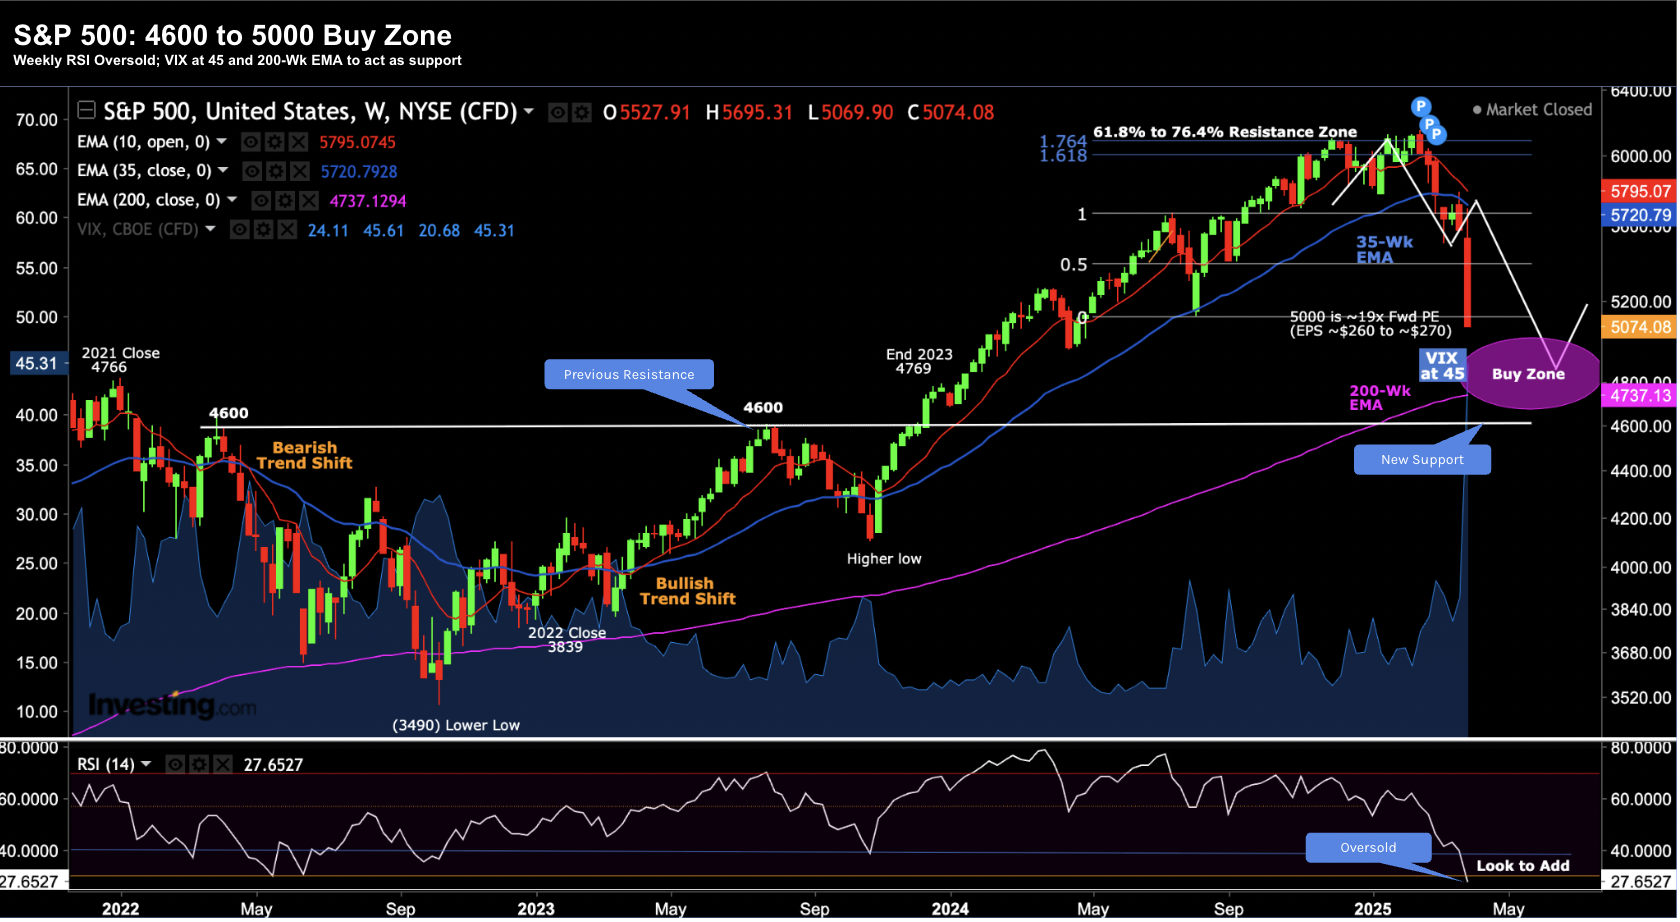
Technical Outlook: March 31, 2025
The thesis was simple: a test of the 200-week EMA would likely find support. This level offered a compelling long-term risk/reward profile, particularly for high-quality, market-leading names like Alphabet, Amazon, and Microsoft, or broad-based exposure via the SPY and QQQ.
Let"s examine the updated weekly chart as of April 24:
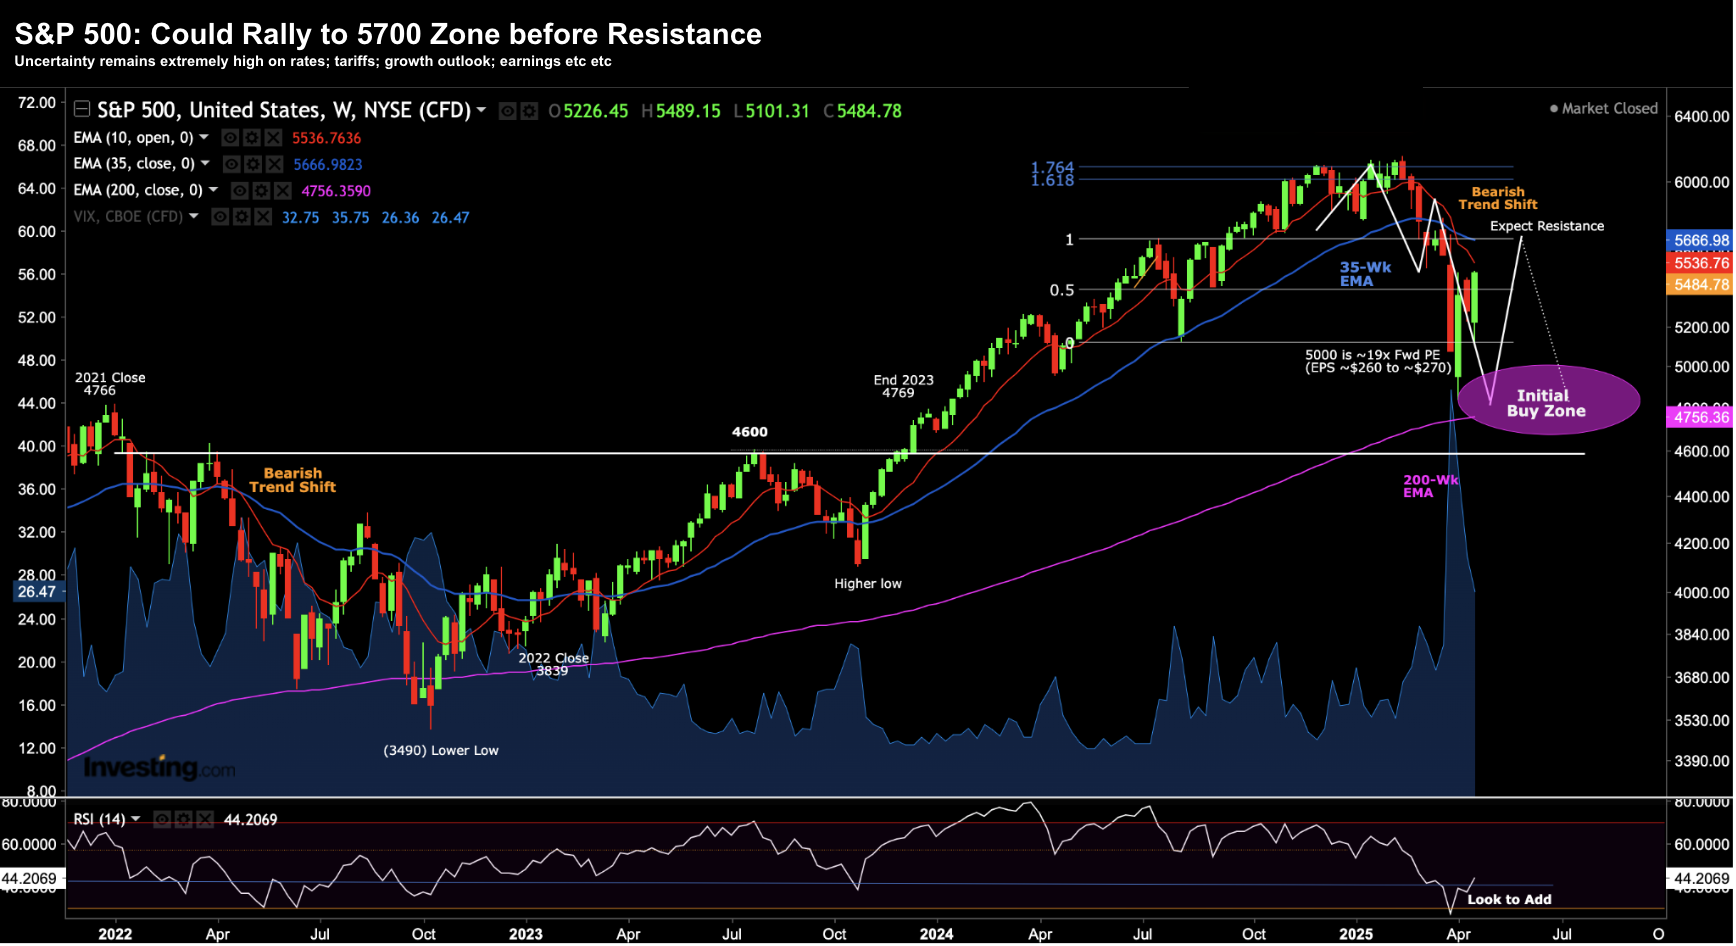
Technical Update: April 24, 2025
The rally from the sub-5,000 level has followed the script, but we are now approaching a zone of significant friction. From a technical lens, the 35-week EMA near 5,700 acts as primary resistance. In a declining market—where the short-term trend is below the long-term trend—rallies to this average are often met with renewed selling pressure.
However, I prioritize fundamentals over technicals. Over the long term, earnings determine the price ceiling. In the short term, emotion and momentum create the "whippy" swings that allow patient investors to outperform.
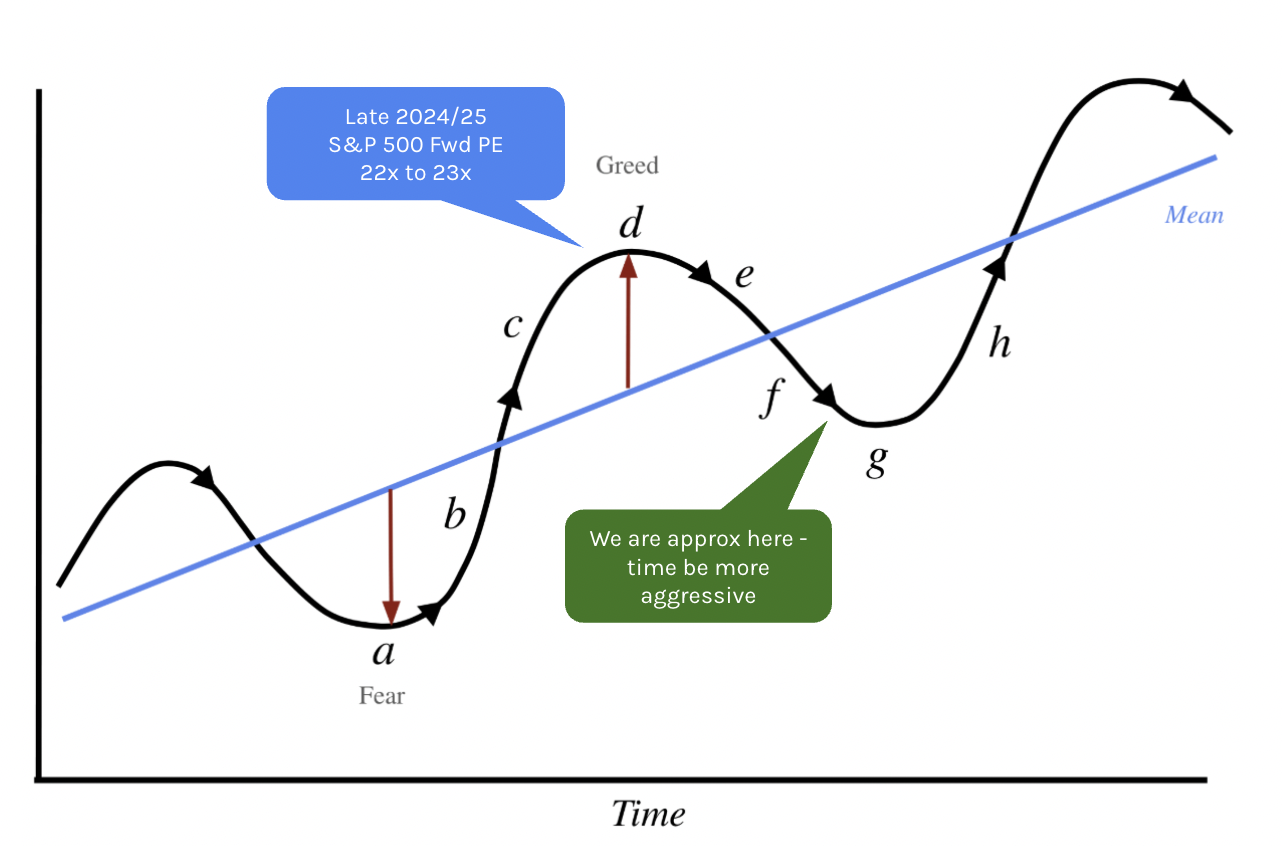
If we apply a logical lens to the valuation: Current market estimates suggest $275 EPS for the S&P 500 this year. At 5,700, that implies a forward PE of ~21x. This is an expensive price to pay given the erratic nature of current trade policy and the uncertainty surrounding interest rates.
If we look at the situation from the opposite perspective—asking what would cause this to fail—it begins with downward earnings revisions. I expect estimates to settle between $250 and $260 per share. Applying a more rational 19x multiple (consistent with my valuation targets for high-quality assets) to $260 in earnings brings us back to the 5,000 level. In this climate, reclaiming all-time highs appears unlikely in the near term.
The "Trump Put" and Market Reactions
The recent shift in tone—the announcement that there is no intention to fire Fed Chair Jerome Powell and a softer stance toward China—suggests the administration is extremely sensitive to market losses.
This has given rise to the modern "Trump Put." It appears the "strike price" where the administration begins to worry sits in that 4600 to 5000 zone. We have seen the administration "blink" twice: once with the 90-day tariff pause and again with the reassurance regarding the Federal Reserve. Each time the market plunges toward the 200-week EMA, a tactical pivot follows. This confirms that despite the tough talk, the administration is closely watching the ticker tape.
However, checking the market"s "vitals" suggests caution. Look at what is actually leading this rally: Walmart (WMT) has outperformed the S&P 500 by 13% this year. Historically, Walmart"s outperformance is a defensive signal, most notably seen during major market downturns.
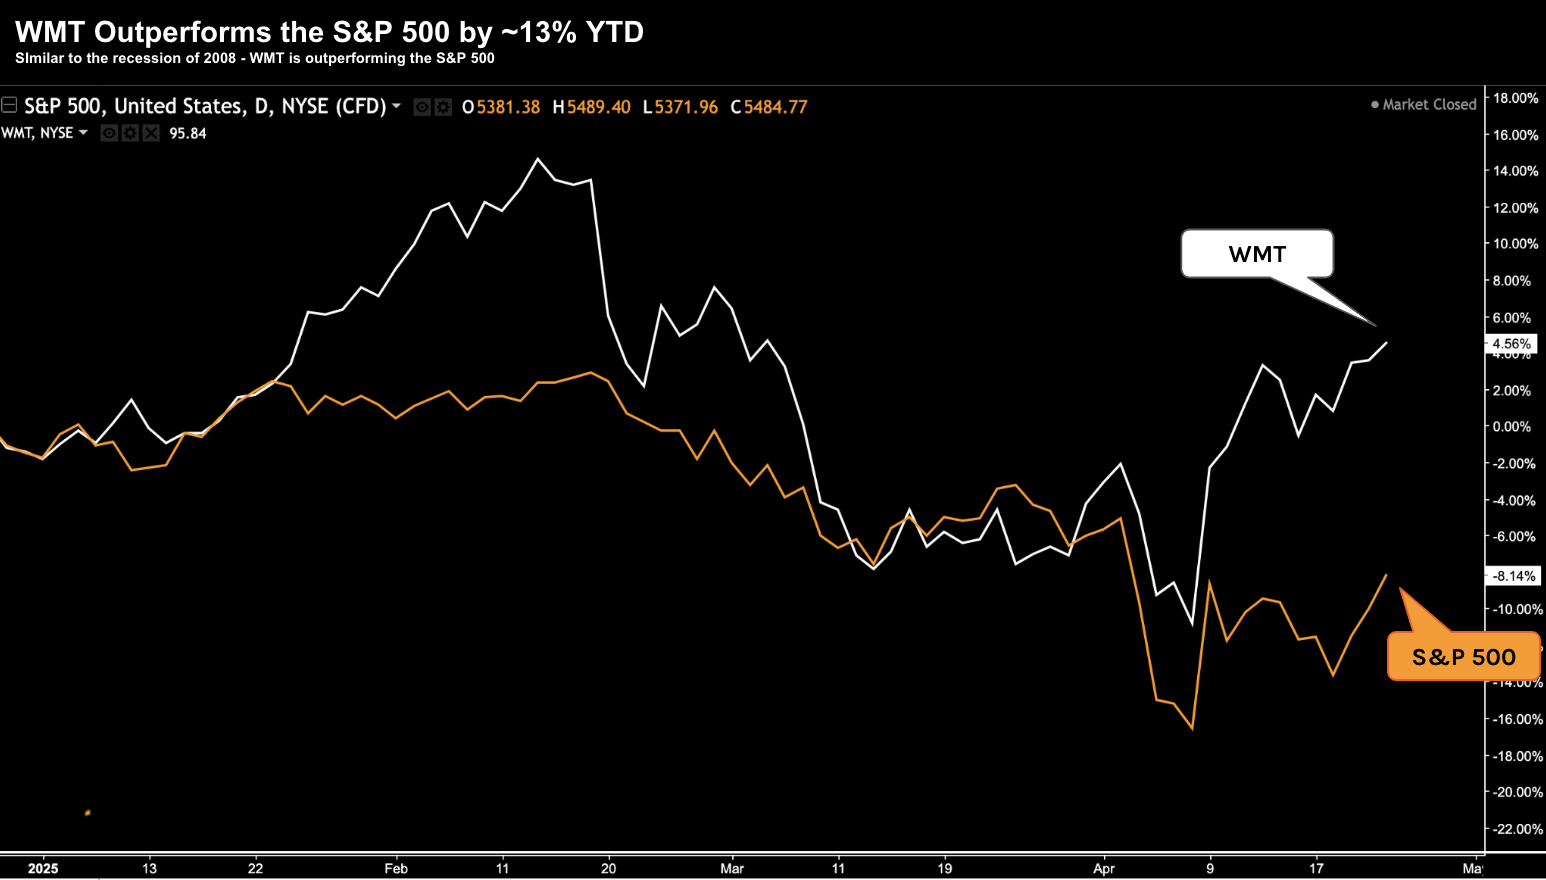
Defensive Leadership: April 24, 2025
Similarly, Gold has significantly beaten equities, outperforming the S&P 500 by 36% YTD. When gold leads by this much, it indicates deep uncertainty and a flight to safety. This reinforces my thesis that any move above 5,700 to 6,000 for the S&P 500 will likely be short-lived as reality sets back in.
The High Cost of Uncertainty
Successful investing requires certainty, and the constant shifting of trade "ground rules" makes it difficult for businesses to plan. While the rhetoric has softened from extreme tariff threats to more moderate figures, the lack of a clear plan remains a drag on economic growth.
The Federal Reserve"s Beige Book confirms this. Tariffs have replaced inflation as the top concern for U.S. businesses. As long as we remain in a period of "negotiation," we will see reduced business investment, which eventually shows up as a hit to future earnings and profitability.
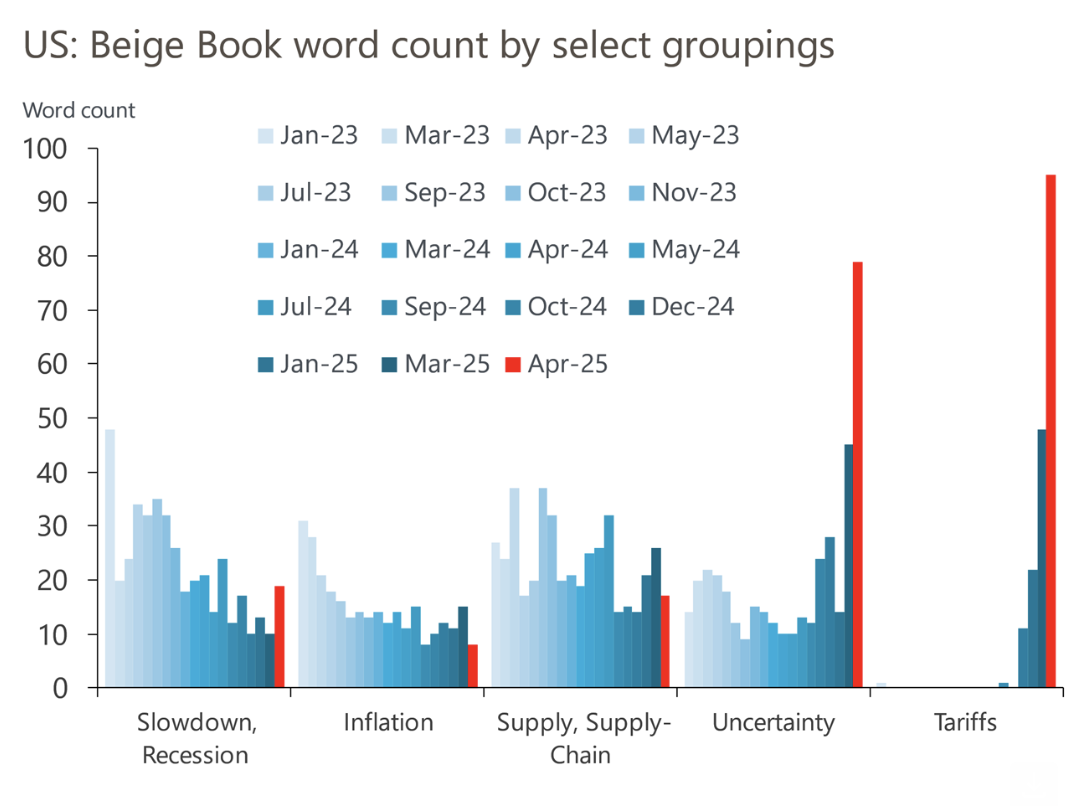
Source: Bloomberg Opinion / Oxford Economics
The "lag effect" of this uncertainty is the primary risk. The damage to business and consumer confidence isn"t easily fixed by a temporary stock market bounce.
Strategic Conclusion
While the relief rally is a welcome bounce, we are not out of the woods. The structural damage caused by shifting trade policy is already being felt in the real economy. As I noted recently, we may already be in a recession, as even modest tariffs have material consequences for growth.
While some analysts remain optimistic with year-end targets above 6,000, my concern is that the delay in policy clarity has already baked in a slowdown. If the economy is indeed slowing down, those high year-end targets are likely too optimistic.
Focus on your areas of expertise: prioritize quality companies, keep a close eye on the 5,700 resistance level, and maintain the cash reserves to capitalize when the market eventually returns to its historical average.