The Patience Paradox: Why ‘Buy and Hold’ Fails at 23x Earnings
Words: 2,618 Time: 11 Minutes
- Why buying the Index and sitting tight for 10+ years doesn"t always work
- Investor returns are largely determined by when you enter
- We can make great money on Wall St… but you should keep it safe elsewhere
"You gotta know when to hold "em, know when to fold "em
Know when to walk away and know when to run
You never count your money when you"re sittin" at the table
There"ll be time enough for countin" when the dealing"s done"
– Kenny Rogers, "The Gambler"
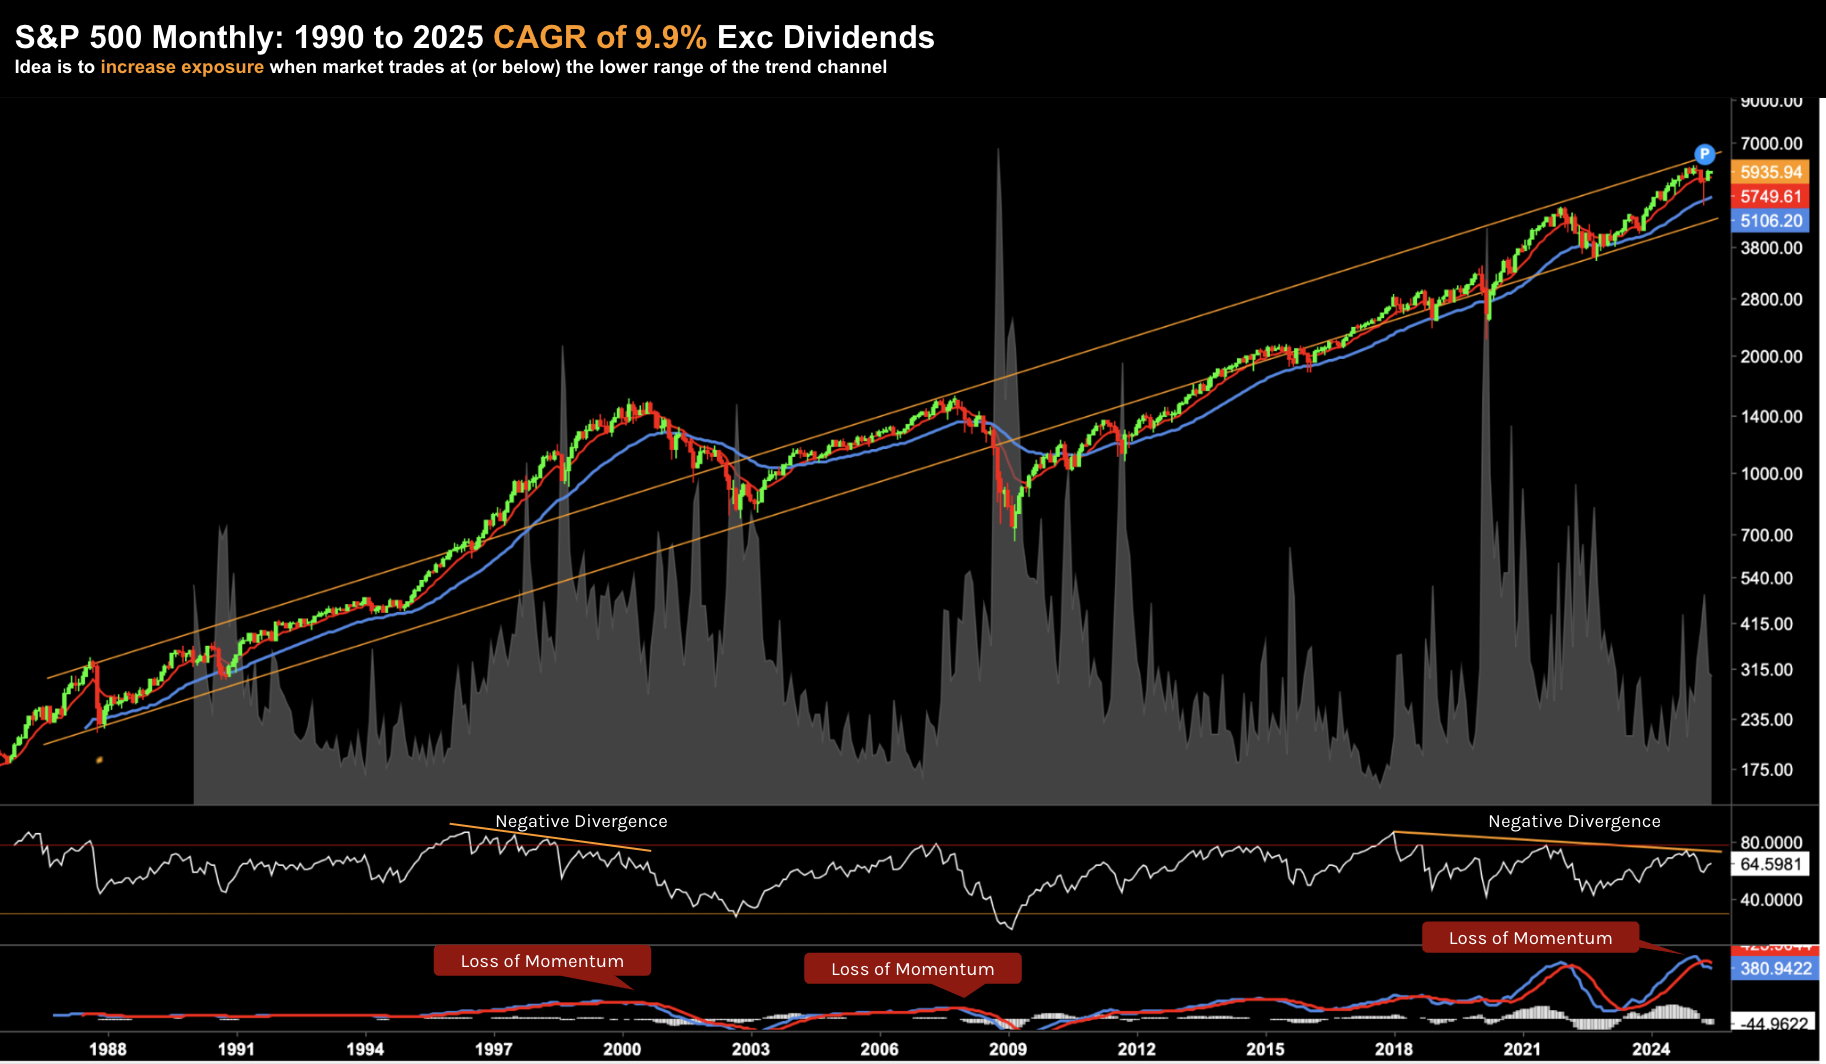
Over the past ~40+ years – the S&P 500 Index has returned an average of ~9.3% annually excluding dividends (from 171.6 Jan 1985 to 5,979.5 Jan 2025)
If we limited that to the past decade (from 2015) – that average annual return increases to 11.4% (excluding dividends).
As I will share shortly, rarely have investors had it this good…
Today"s exam question:
Is it safe to assume buying the Index – and sitting tight for 10+ years – we will enjoy similar returns?
Unfortunately not.
Investor returns are largely determined by when you entered the market (i.e., the price you paid); and when you get out.
Below I will demonstrate why it"s false to assume Index investing will return ~10% if you simply remain patient.
Patience is important – but it"s only half the equation.
Rarely Have We Had it This Good
To demonstrate how strong returns have been in recent years – it"s worth examining history.
For example, if we look back over the past 100 years (from 1925) – and divide the past century into equal 10 year periods – the results are surprising:
| Start Date | End Date | Start Value | End Value | Total Return (%) | CAGR (%) |
|---|---|---|---|---|---|
| Jan 1, 1925 | Jan 1, 1935 | 10.58 | 9.26 | -12.47% | -1.33% |
| Jan 1, 1935 | Jan 1, 1945 | 9.26 | 13.49 | 45.71% | 3.87% |
| Jan 1, 1945 | Jan 1, 1955 | 13.49 | 35.60 | 163.91% | 10.14% |
| Jan 1, 1955 | Jan 1, 1965 | 35.60 | 86.12 | 141.91% | 9.23% |
| Jan 1, 1965 | Jan 1, 1975 | 86.12 | 72.56 | -15.73% | -1.69% |
| Jan 1, 1975 | Jan 1, 1985 | 72.56 | 171.60 | 136.43% | 8.99% |
| Jan 1, 1985 | Jan 1, 1995 | 171.60 | 465.25 | 171.20% | 10.51% |
| Jan 1, 1995 | Jan 1, 2005 | 465.25 | 1,181.41 | 153.93% | 9.76% |
| Jan 1, 2005 | Jan 1, 2015 | 1,181.41 | 2,028.18 | 71.66% | 5.56% |
| Jan 1, 2015 | Jan 1, 2025 | 2,028.18 | 5,979.52 | 194.89% | 11.39% |
Note: these returns exclude dividends
Here we are able to see how 2015 to 2025 has been a very rewarding period for investors.
Only two other periods come close (1945-1955 at 10.4%; and 1985-1995 at 10.5%)
However, what"s noteworthy is there are two 10-year periods where returns were negative (1925-1935; and 1965-1975)
Think of it this way:
There was a 1 in 5 chance of negative returns if held over 10 years (something an investor under the age of say ~60 would find difficult to comprehend).
1 in 5 is not insignificant and a point often missed by those who advocate simply "buying the index" and staying patient (i.e., the funds management industry)
But what if we change the holding period to 20-year intervals (a very long holding period for any investor)
| Start Date | End Date | Start Value | End Value | Total Return (%) | CAGR (%) |
|---|---|---|---|---|---|
| Jan 1, 1925 | Jan 1, 1945 | 10.58 | 13.49 | 27.5% | 1.21% |
| Jan 1, 1945 | Jan 1, 1965 | 13.49 | 86.12 | 538.5% | 9.20% |
| Jan 1, 1965 | Jan 1, 1985 | 86.12 | 171.60 | 99.2% | 3.56% |
| Jan 1, 1985 | Jan 1, 2005 | 171.60 | 1,181.41 | 588.8% | 9.42% |
| Jan 1, 2005 | Jan 1, 2025 | 1,181.41 | 5,979.52 | 406.0% | 8.21% |
In short, holding for 20 years has eliminated negative returns.
That said, we find two 20-year periods where investors experienced poor returns (e.g., well below that of fixed income):
- 1925 to 1945 – CAGR of 1.21%; and
- 1965 to 1985 – CAGR of 3.56%
There are two key lessons for investors from both tables:
- Contrary to the popular "buy and hold" wisdom – it"s not a given the S&P 500 will simply average 10% annually in any 10-year (or 20-year) period; and second
- It entirely depends on when an investor buys and equally – when they get out.
Coming back to Kenny Rogers: "you gotta know when to hold "em, know when to fold "em"
This begs an important question…
How can you improve your odds of higher returns over the long-run?
The good news is there is a way… but it requires a contrarian mindset.
Patience Alone Doesn"t Get it Done
Given today"s lofty valuations (i.e. a market trading at 22x forward earnings) – and a generational bull run (e.g., CAGRs of 11%+ for around a decade) – this post is timely.
This isn"t a post which only has relevance this week, month or year (i.e., what you get from CNBC or Bloomberg) – it"s one which you can re-read in "10 or 20" years and should still hold water.
Whilst the 10- and 20-year interval tables demonstrate the variability of returns in any period – it also tells us that runaway bull markets are often not the best place for safekeeping.
Consider Warren Buffett…
Buffett has been a renowned market timer for more than 60 years (1964 to 2024) – arguably longer.
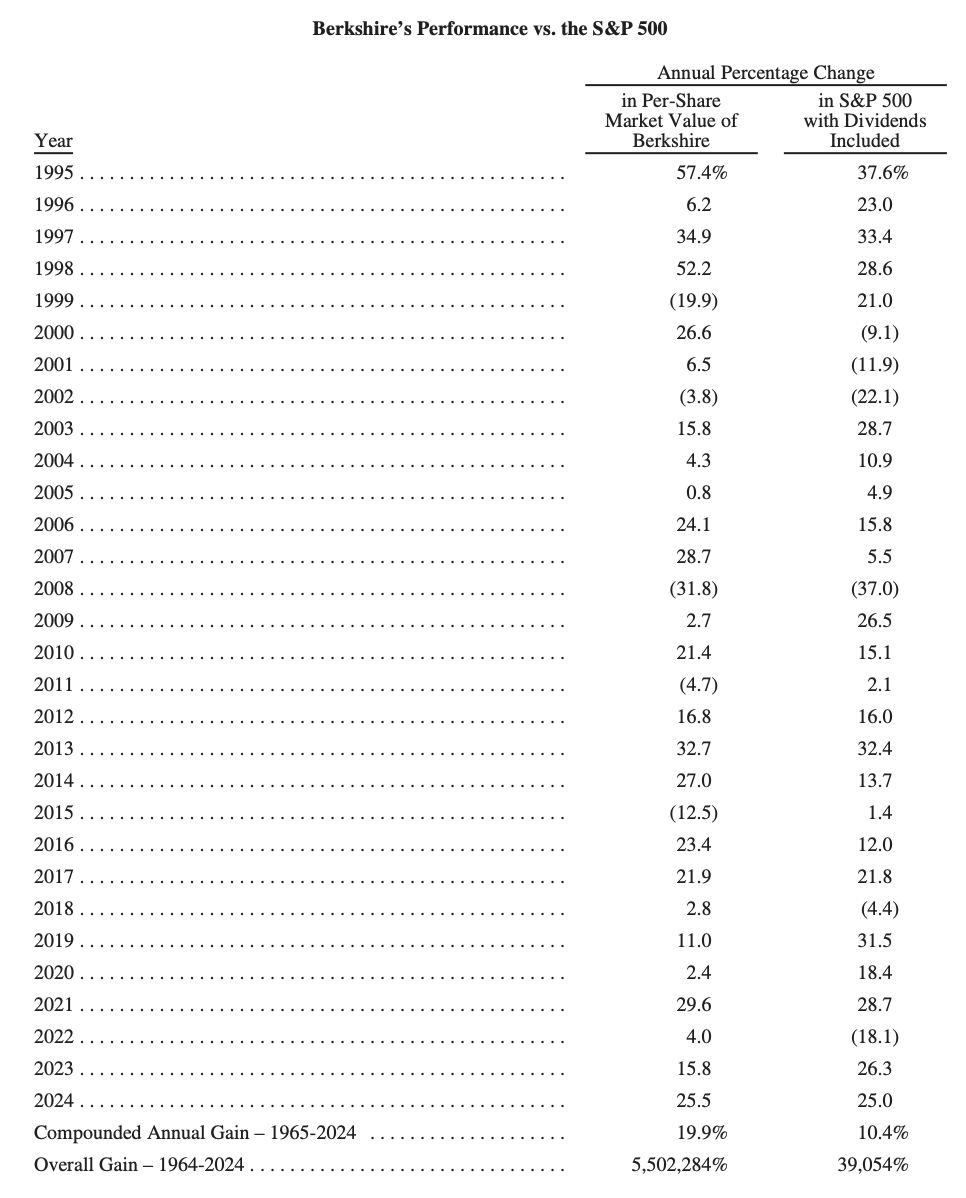
Very few match his near ~20% CAGR returns over this length of time (see pages 14 and 15 of his annual report – with 1995 to 2024 below)
The perceived wisdom is the Berkshire Hathaway chairman built his fortune by buying good companies and holding them long term.
However, that"s only partly true.
For example, if for the formula for achieving "billions in profit" were so simple – why wouldn"t everyone do it?
And that"s the thing many fail to recognise; i.e. patience was only half of Buffett"s model.
Throughout his entire career – Buffett has a proven history of when to hold and more importantly – when to fold.
Both require patience and often – a contrarian mindset.
Granted, he usually holds his positions for long periods of time.
For example, often he is buying an asset which is out of favor – which implies the asset needs time (i.e. patience) for the market to recognize its (true) intrinsic value.
But more than this, Buffett learned early in his career (thanks to Ben Graham) that the stock market is not always the safest place for an investor to "store" their hard-earned dollars.
The Oracle of Omaha understood that equity markets, like all other markets, are cyclical – where there can be long stretches of time when a prudent investor should get out and stay out.
Put another way – he exercises patience (i) waiting for the right time to enter a stock (typically at a strong discount or margin of safety; and (b) patience once he has taken the position.
Let"s circle back to our 10-year interval table….
Here I specifically want to highlight the decades 1955 to 1965; and 1965 to 1975
| Start Date | End Date | Start Value | End Value | Total Return (%) | CAGR (%) |
|---|---|---|---|---|---|
| Jan 1, 1955 | Jan 1, 1965 | 35.60 | 86.12 | 141.91% | 9.23% |
| Jan 1, 1965 | Jan 1, 1975 | 86.12 | 72.56 | -15.73% | -1.69% |
A 27-year old Buffett launched his professional investment career in 1957, when the bull market that began after World War II was still young.
And as our first table showed – it had taken the market nearly 20 years to recover from the Great Crash of "29.
With returns flat to negative for almost 20-years – even the most "steadfast" of investors were wary of buying stocks.
But an investor bold enough to take a position in 1948 (i.e., contrarian) would find that by 1968 they had more than quintupled their money.
Again, the CAGR between 1955 and 1965 was an impressive 9.23% excluding dividends.
Buffett also set up his first shop in the fifties (before Berkshire Hathaway in 1964)
In those early years, he managed a pool of money for a group of close clients, many of them friends and acquaintances, forming what he called the "Buffett Partnership".
Over the next decade (which is not shown in the Berkshire Hathaway performance table) – he would return a stunning 1,156% vs the Dow 122%
Put another way, Buffett"s 10-year CAGR before Berkshire was an incredible 28.7% vs the Dow"s CAGR of 8.4%
As the "go-go" sixties began – the raging bull took shape (i.e., delivering almost ~10% per annum in average returns).
1968 saw its peak – more than doubling in value over 7 years (note: CAGR of 10.4% over 7 years will see your money double)
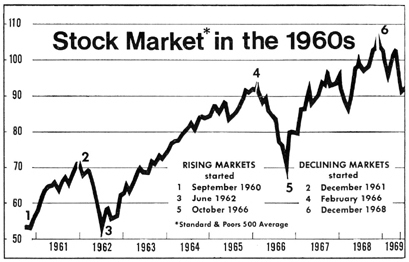
But here"s how Buffett would eventually crush the market;
During 1966 (about two years before the market peaked in "68) – Buffett realized that a bull this brazen was just asking to be replaced by a bear.
Valuations were simply too high.
Worried that he would not be able to find a safe home for fresh money, Buffett closed his partnership to new accounts.
Still, the Buffett Partnership flourished, thanks in large part to the bargains Buffett had found earlier in the decade.
In 1967 his fund rose 36% more than twice the Dow"s advance.
And in 1968 – he returned 59%. Here"s Buffett from his 1969 newsletter:
"The game is being played by the gullible, the self-hypnotized, and the cynical"
In May of 1969 – he announced he was liquidating the Buffett Partnership – cashing in his chips.
Buffett spent the rest of the year selling stocks so that he could return his investors" money-plus the handsome profits their investments had accumulated over a period of years.
He advised them that he was putting most of his own money into municipal bonds (at an average yield of around 5.8%), while holding on to just two stocks:
- Diversified Retailing – a small holding company for a dress chain, and
- Berkshire Hathaway – a textile company
He said at the time "…while I didn"t think much of textiles; I liked the guy in charge"
Buffett gave his investors a choice between two assets:
- Keeping their Berkshire Hathaway shares; or
- Taking the cash
He pointed out that he planned to hold on to his own Berkshire shares. The rest is history.
Being Greedy When Others are Fearful
With Buffett"s cash safely buried in Main Street (and out of Wall Street"s grasp) – he was not seduced by the rallies that followed his exit in May of 1969.
For example, from 1969 through 1973, the market experienced several sharp rallies.
- 1969: The S&P 500 experienced a decline of -15.19%.
- 1970: The market saw a slight recovery, with a total return of 4.01%.
- 1971: The S&P 500 continued its upward trend, with a total return of 14.31%.
- 1972: The market saw further growth, with a total return of 18.98%.
With returns of 14.3% and 18.98% – many would have declared the bear market of 1969 over.
However, despite the strong rallies — Buffett continued to stay out.
Drawing a parallel to today (and the enthusiasm around AI stocks) – nor was he tempted by the so-called Nifty Fifty growth stocks.
As a value investor, committed to "buying low and selling high," Buffett understood that everything depends on the price you pay when you get in.
In that sense, any value investor is a market timer.
For example, at the end of a cycle, when prices are stretched (and greed is rife) – he used that opportunity to sell.
And in Buffett"s view, in the early seventies prices still were exorbitant.
It was not until 1973, when the Dow went into free-fall, that the market once again commanded Buffett"s attention.
As he told Forbes late in 1974:
"All day you wait for the pitch you like; then when the fielders are asleep, you step up and hit it."
Two things:
- Whilst Buffett"s exit from stocks was arguably early – he was not late. After all, if he had hung on, he could have ridden the Dow to the very top: 1071 in January of 1973. Being early is always better than being late; and
- He had the conviction of his own judgement to step up and buy quality assets when valuations were attractive (where very few others could conquer their fears) and
With respect to selling – Buffett was not concerned about catching the top of the wave.
We cannot predict either tops or bottoms.
He was far more interested in not losing the extraordinary returns he had made.
That"s far more important.
While most investors are motivated by a desire to make money, Buffett focused first on not losing money.
But compare that to the average investor…
They will agonize over the prospect of getting out too early and missing out on the profits that would have made them rich.
Sound familiar?
But the very rich don"t fret so much about making money. They have money. Their greatest fear is losing it.
Now in 1973, when virtually no one else wanted to buy stocks, Buffett went on a buying binge.
Corporate America was on sale, and Buffett snapped up one company after another at 7x their forward earnings (and sometimes less):
- National Presto Industries
- Detroit International Bridge
- Sperry & Hutchinson
- U.S. Truck Lines
- J. Walter Thompson
As the Dow plunged, Buffett is reported to have said: "You know – some days I get up and I want to tap dance"
Corporate America was on sale… and his ~4 to 5-years of patience paid dividends (literally!)
Like 1949, 1974 was a very good year to begin buying stocks.
Most investors were less fortunate…
By 1974 they were tapped out, both financially and psychologically.
And as our earlier table showed – it would be a long time before they made their money back.
Although the market hit rock bottom that year, the Dow would not again cross 1000, and stay there, until 1982… some eight years after the crash.
Only then would a new bull run begin.
Two lessons:
- Buffett made money because he bought close to the bottom… when fear was at its peak
- The majority of investors who remained in the market in the mid-seventies had established their positions in the late sixties or early seventies, when prices were much higher.
Below is the comparison of Buffett"s returns vs the S&P 500 during this period:
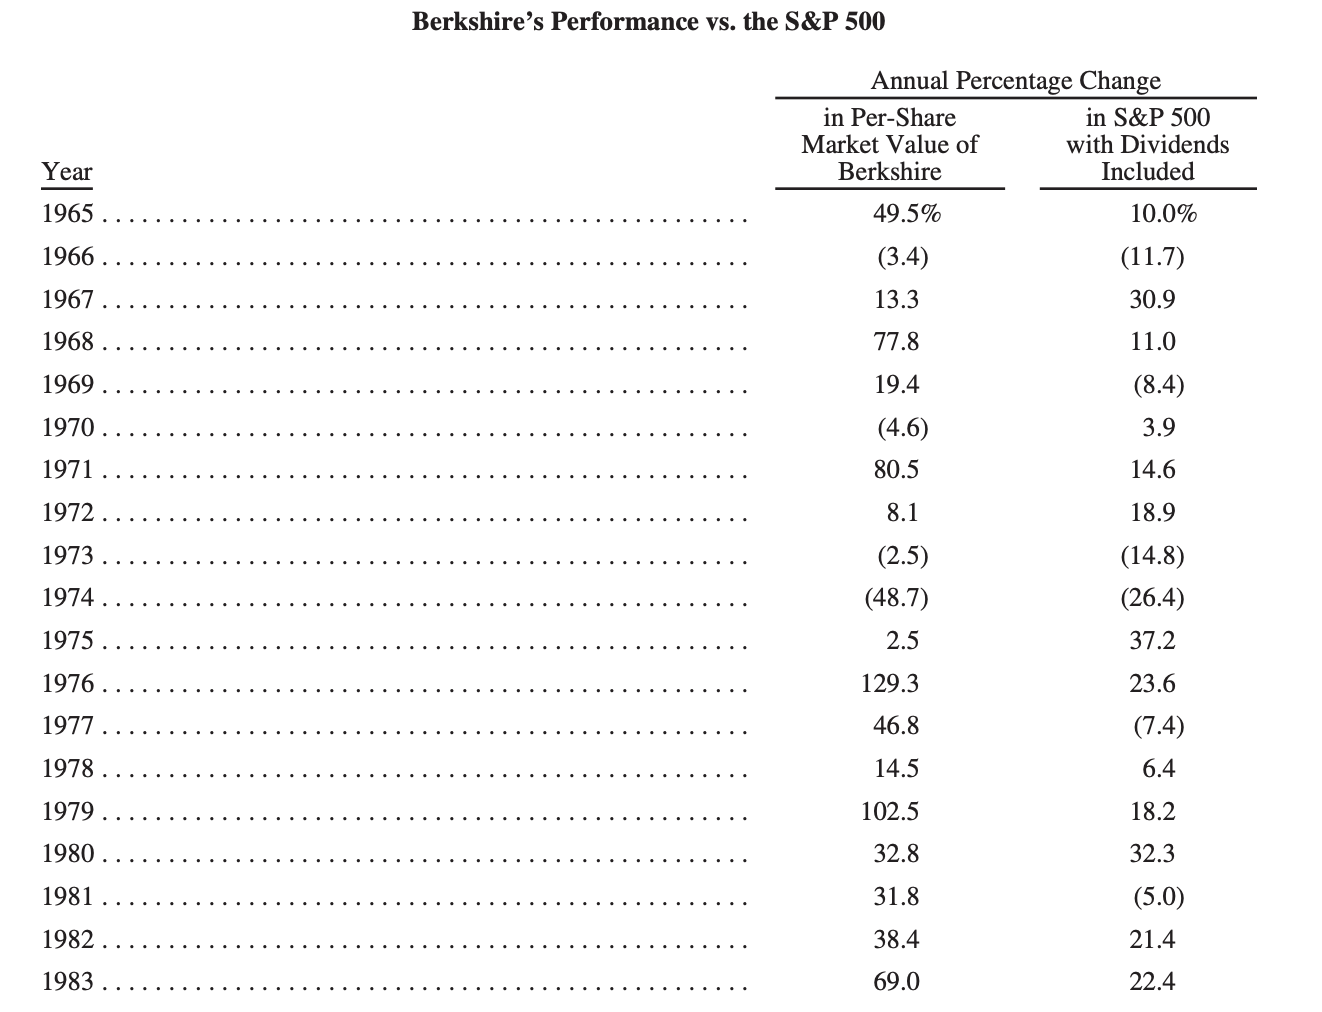
Following the crash of 1973-74 – where the S&P lost 14.8% and 26.4% in consecutive years – Buffett capitalized – realizing stellar gains every year between 1976 and 1983 (leaving the S&P 500 in his wake)
Putting it All Together
My thesis is that the next decade may not be as kind as the past ten years.
History would also suggest that could be the case.
For example, buying the index today at 22x forward earnings is a very high price to pay (especially with 10-year yields offering around 4.50% — see this post).
And perhaps Buffett agrees…
Today he sits in the highest cash position (as a percentage of his total portfolio) in decades – some $348B (and rising) — having overseen more than $174 billion in net stock sales over the last ten quarters.
Why?
In his own words – he sees very little which is compelling.
"We are impartial in our choice of equity vehicles, investing in either variety based upon where we can best deploy your (and my family"s) savings.
Often, nothing looks compelling; very infrequently we find ourselves "knee-deep" in opportunities"
You only have to look at the very limited occasions Buffett makes "big bets" to understand just how infrequent you get (very) compelling opportunities.
Now on the "sell side" of the ledger – it"s worth reiterating that Buffett could be "3 or 4 years" too early selling more than $174B in stock this (and last) year.
As I"ve written many times – perhaps the S&P 500 goes on to achieve new highs over the next few years.
It would not be surprising. Momentum can be a powerful force. But you need to let it go.
Buffett could not care less about timing a market top. Not interested.
He doesn"t want to lose money.
That"s his number one priority (and it should be yours too).
But at some point, when investors panic and fear takes hold (i.e., where very few are willing to buy or are tapped out) – you can be sure he will start putting that $340B+ to work for the next "10+ years".
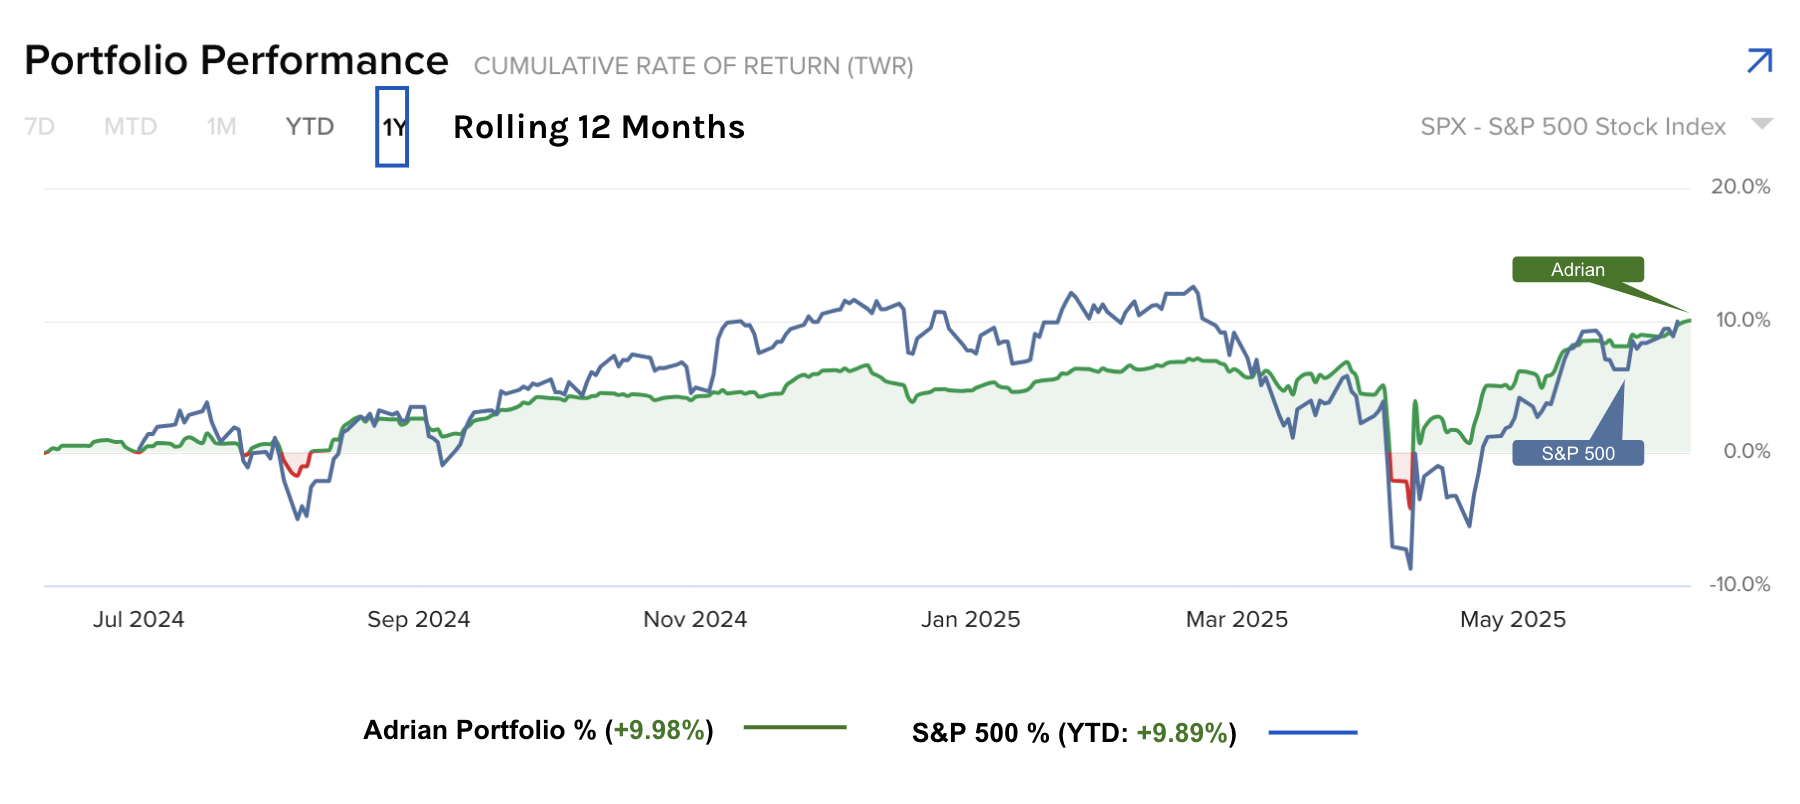
My own approach this year has been to take some chips off the table.
I"m sitting in around 35% cash – very similar to Buffett as it turns out.
And below is my rolling 12-month return (matching that of the S&P 500):
In closing, stocks are not cheap.
Therefore, it would not be unwise to say "thank you Mr. Market" for the incredible returns the past decade – time to put some cash aside for safekeeping – until they start offering value.
As a follow-up to this post – I will explain the primary 4 reasons why Buffett looks to sell stocks.