Category Asset Allocation

So Maybe Valuations Matter?

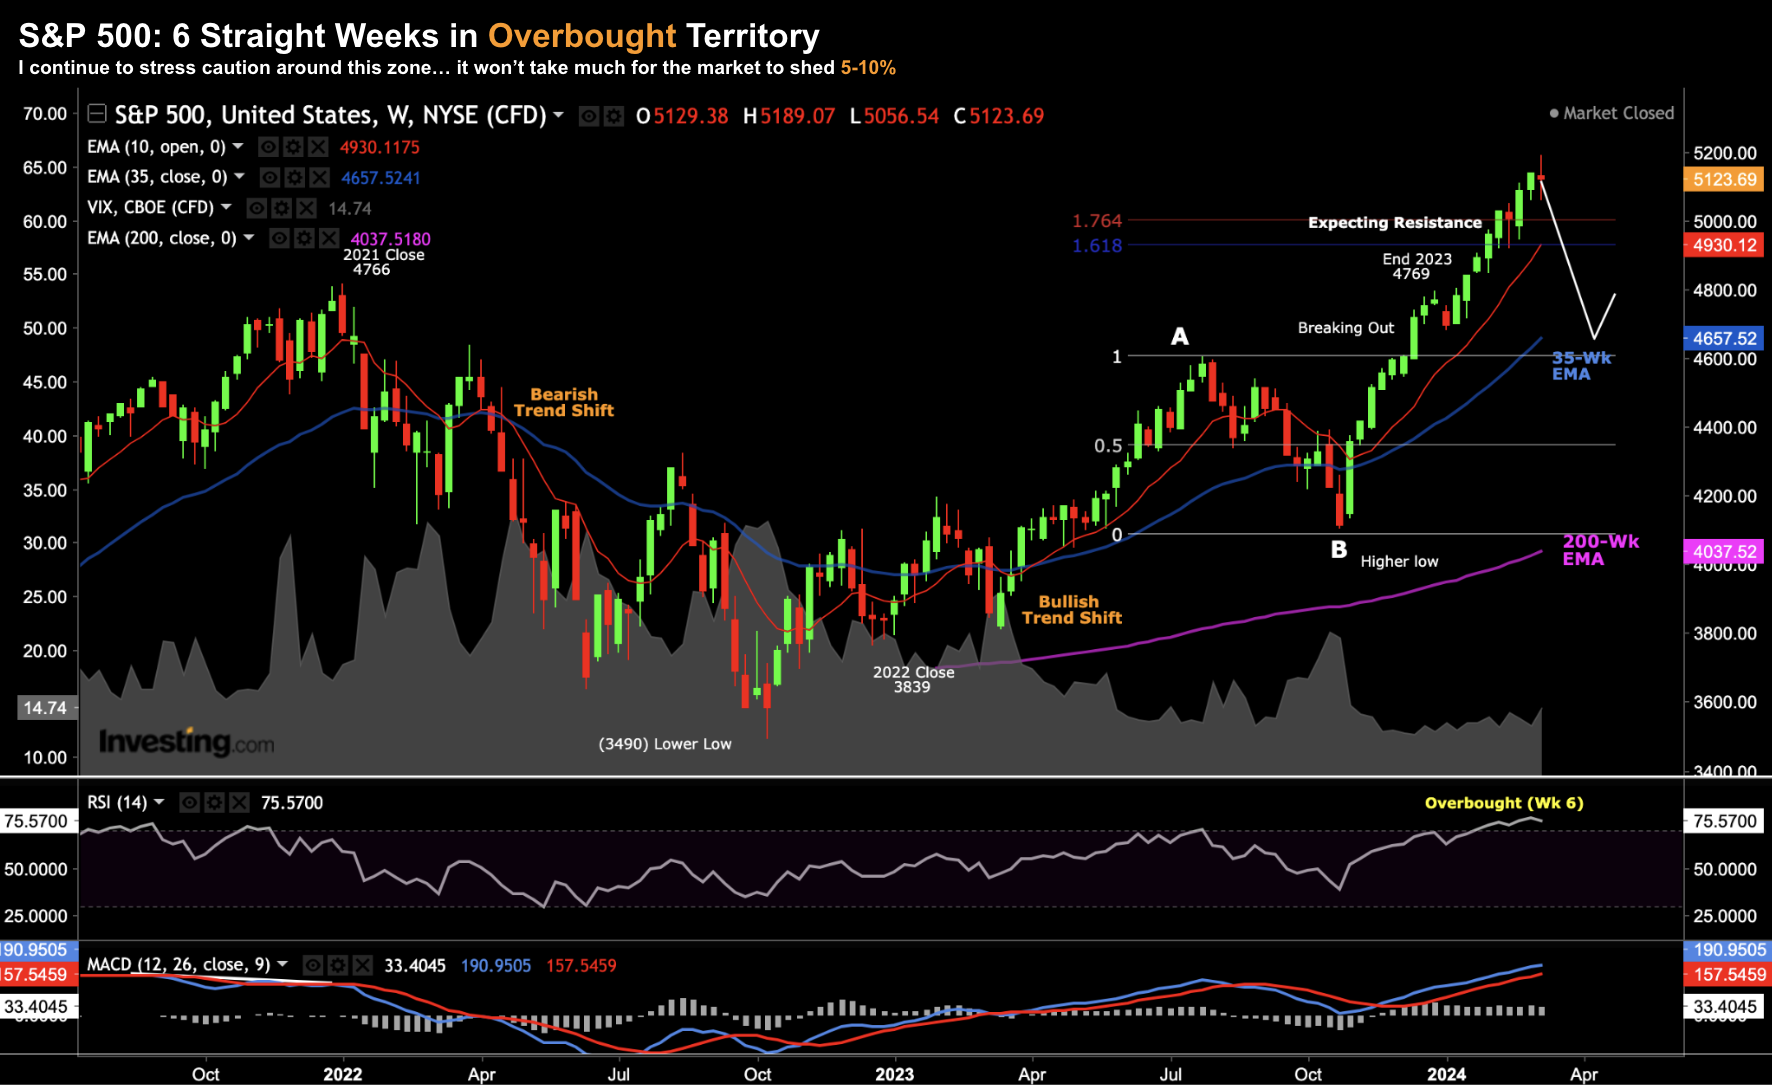
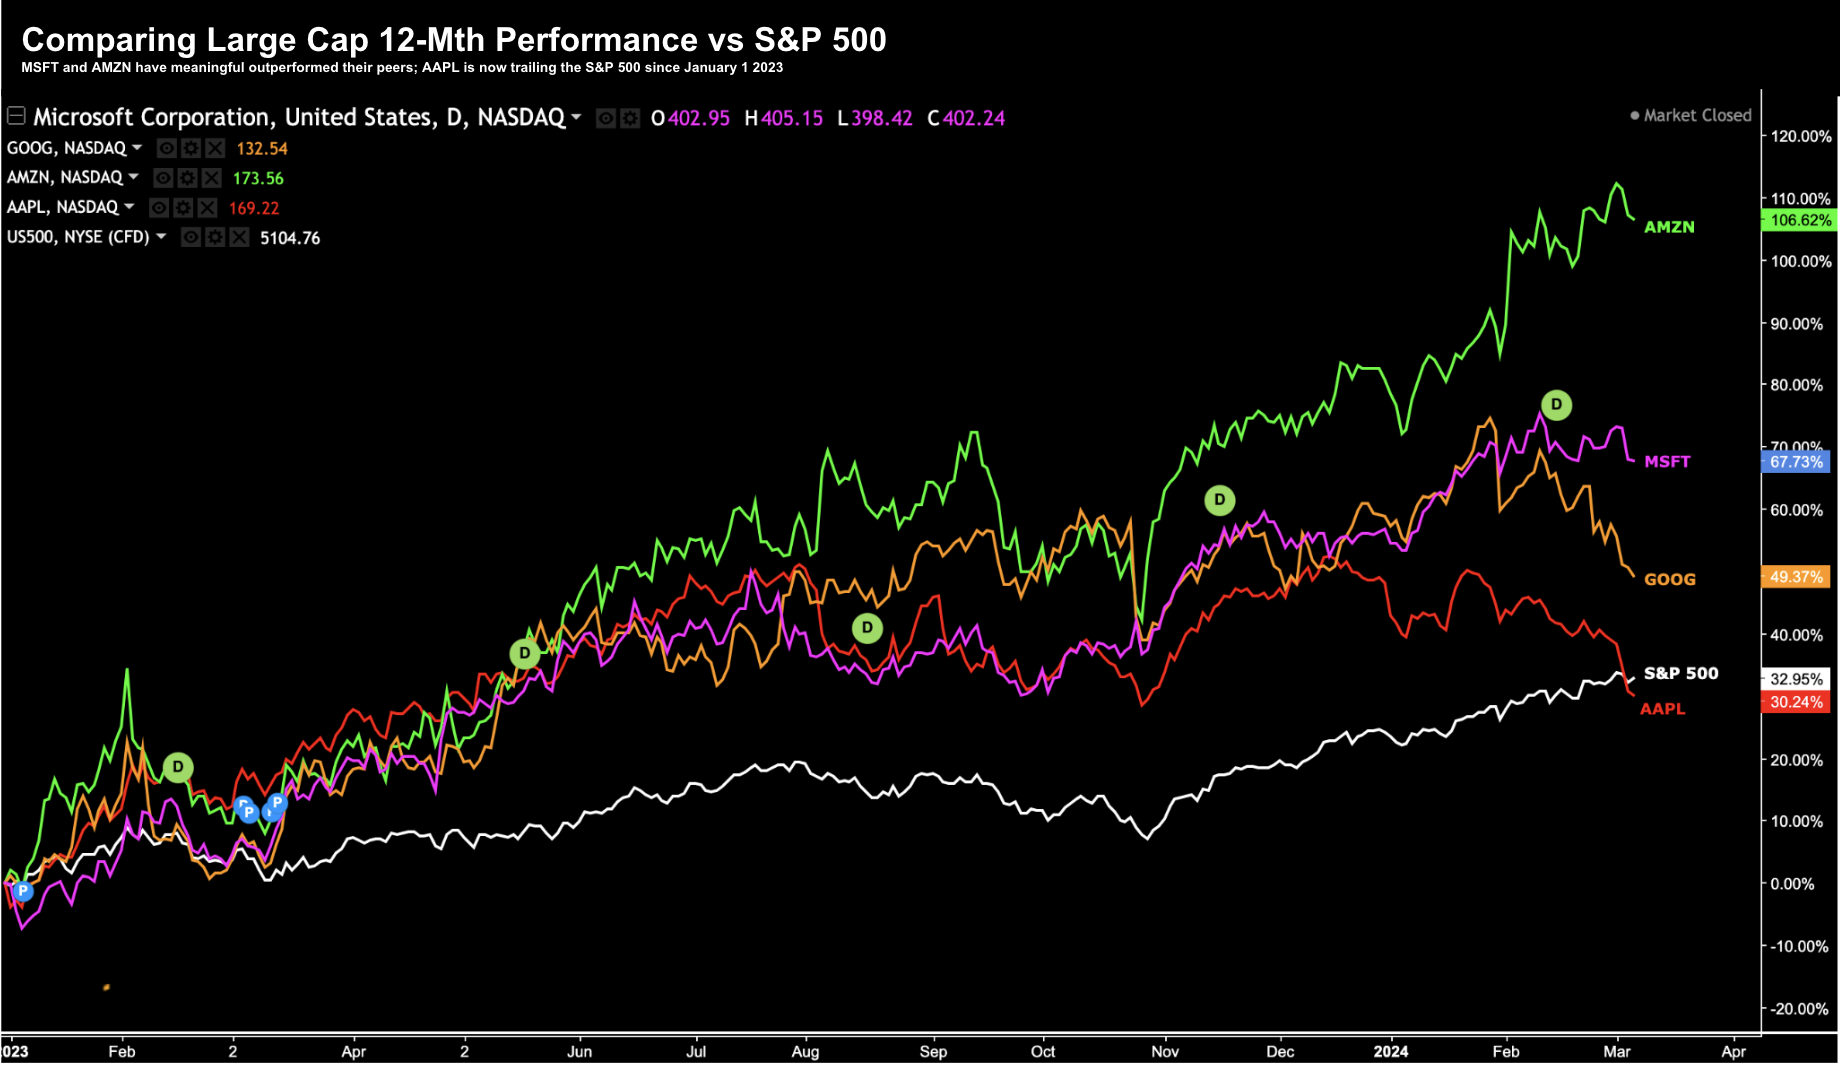
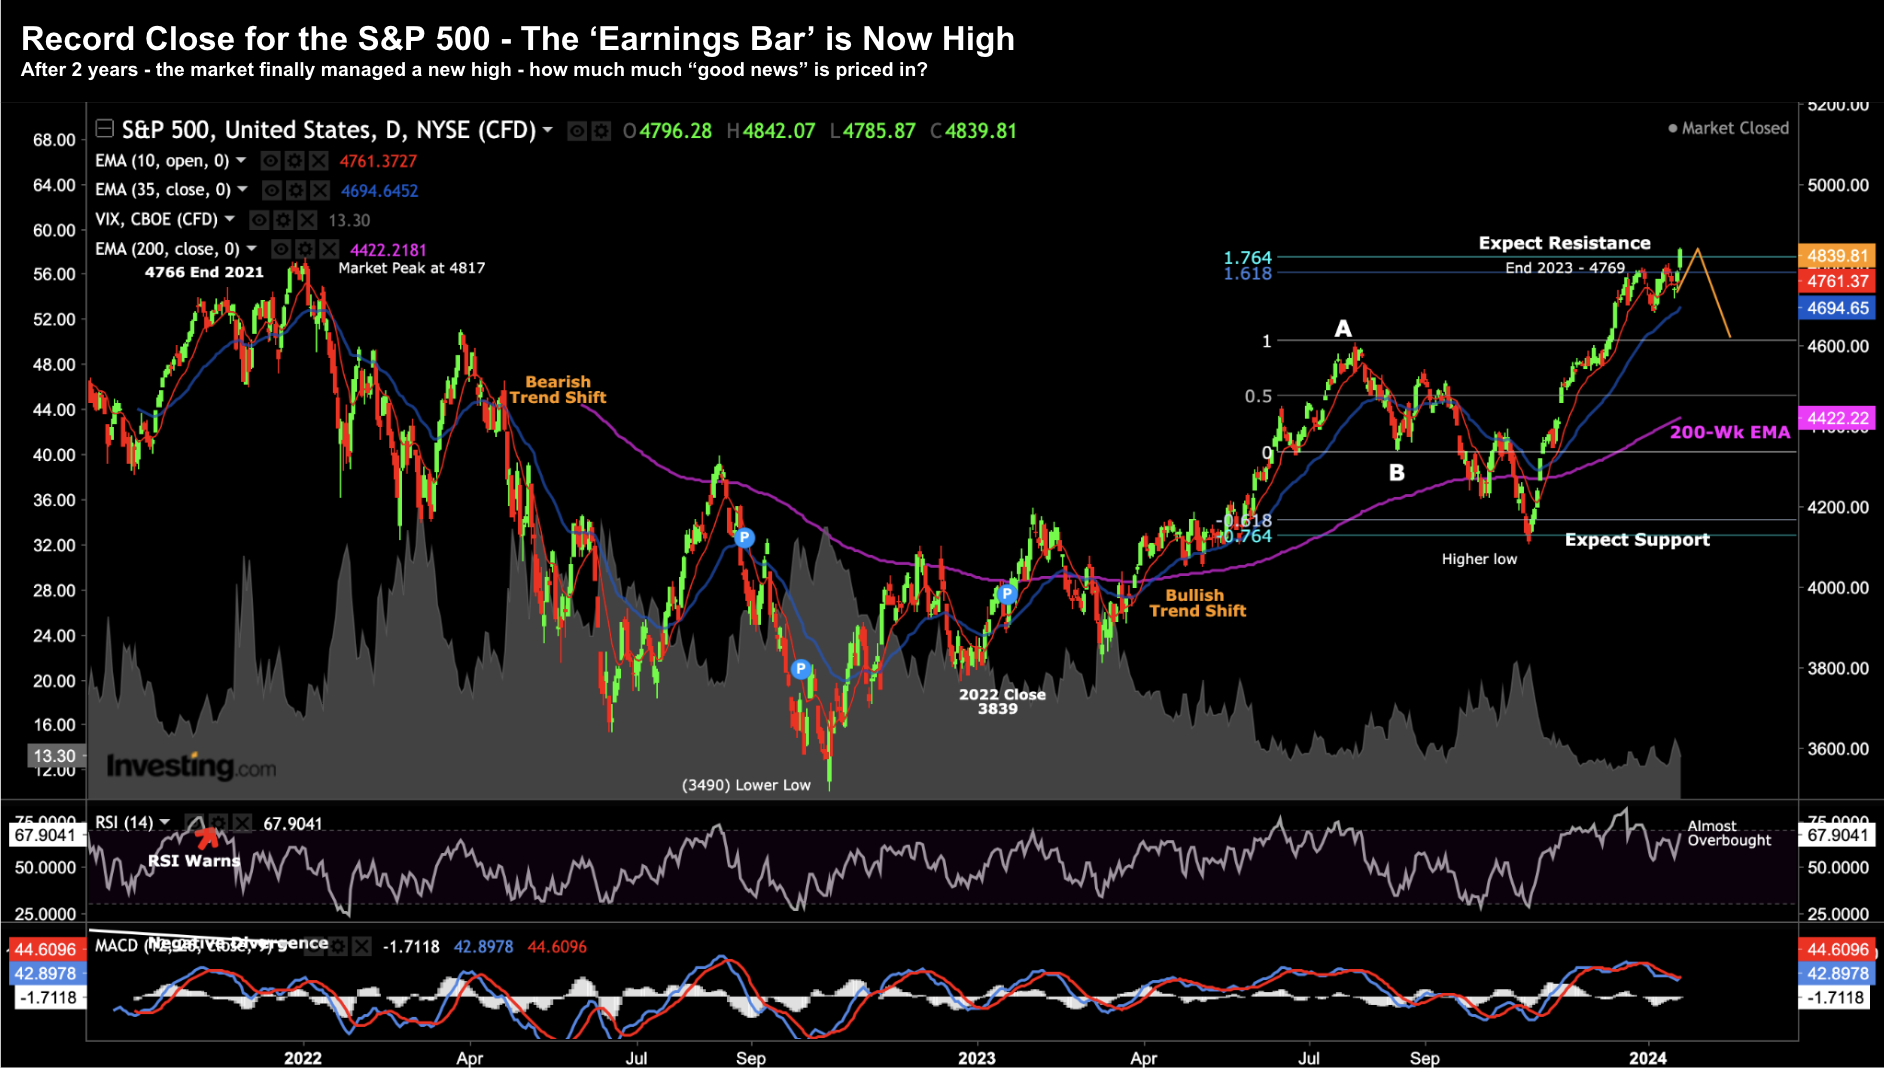
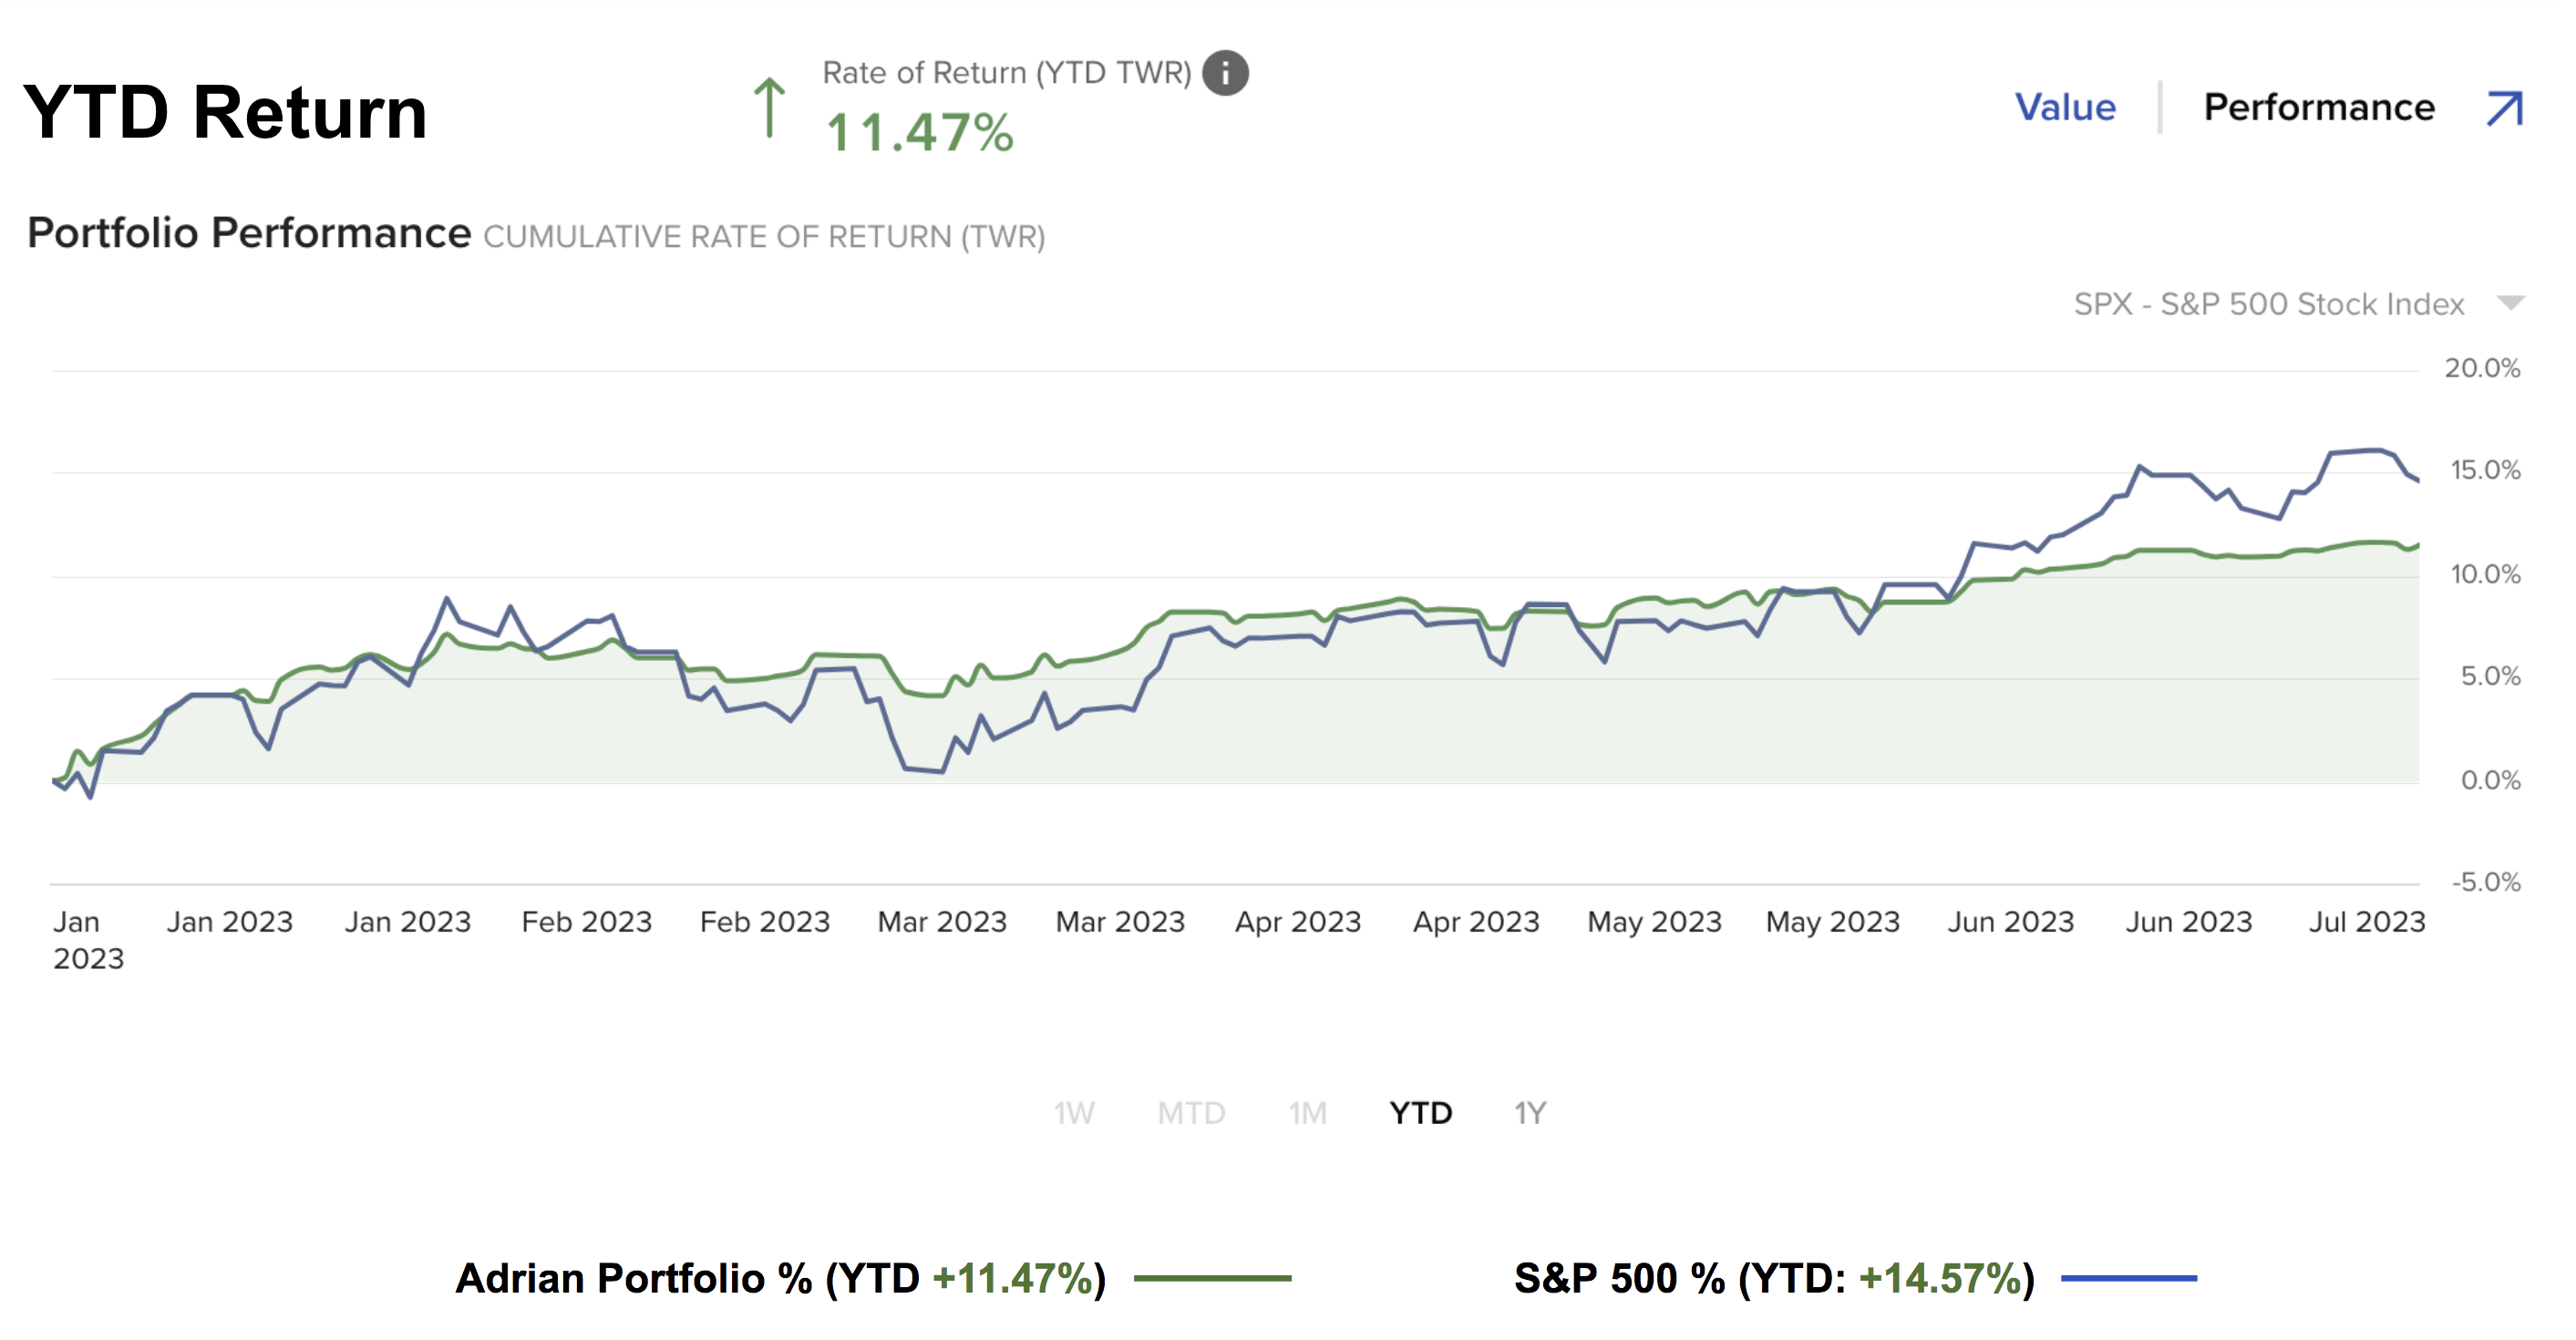
When I made the difficult decision to reduce my exposure to large-cap tech earlier this year - I wasn't sure how things would pan out. In the short-term - I looked foolish. These stocks surged higher without me. However, since then, large-cap tech is trading lower than when I sold it (on average). But is this a dip you should buy? I don't think so - not just yet. The broader index is only 6% off its all-time high. That's nothing in the larger scheme of things. I'm choosing to remain a little more patient - where I think the index could correct somewhere in the realm to 10-12%.

Are Semi’s Set to Cool their Gen-AI Heels?

Whilst the technology sector is outperforming the benchmark index this year -- semiconductor stocks have done the bulk of the heavy lifting. And it's not difficult to explain investor FOMO. It's entirely due to the hype around "AI" and specifically something called "Generative AI". For example, in a report by Grand View Research, they valued Gen-AI at ~$13B last year. However, its anticipated CAGR is estimated to be ~36% - which puts the industry hitting $109B by 2030. That's a sharp ramp higher from basically zero two years ago. And today - there a very few chipmakers who produce the GPUs required to meet the insatiable demand. However, is the demand semis are seeing today (and revenue) sustainable long-term? That's unlikely.

Apple: Ready to Take Another Bite?

Apple is ~15% off its all time high as it lags its large cap peers. Concerns of iPhone growth and China have rattled investors. However, it's not unusual for this stock to pull back. Since 2107, we have seen 11 retraces - offering patient investors buying opportunity. From my lens, Apple is a reasonable long-term buy around $165. And if you can get it cheaper - add to it. Over the next 3 years - I think it will be well over $200 as earnings top $8.00 per share.

Something Doesn’t Add Up… 

It's Nvidia's world and we're living in it (if you believe the stock market). The S&P 500 (and Nvidia) recorded all new highs post the AI chip maker's earnings. Be careful paying too much. The rapid rise in Nvidia's market cap has only seen the market narrow further. And from mine, that makes it more subject to both volatility and risk. Deutsche Bank’s Jim Reid dimensioned the risk another way. He shows how the Top 10% of stocks in the S&P 500 constitute ~75% of the total capitalization. We have not seen that since 1929! The only other time we saw something similar was the dot.com bubble...

Mean Reversion: Index Risks & the ‘M7’

In the game of asset speculation – mean reversion suggests that over time an asset will eventually return to its average price if it drifts or spikes too far from that average level. If applied, it can often help you avoid paying too much. My thinking is the S&P 500 has now drifted too far from the longer-term mean. History has always told us that inevitably prices will mean revert. This post explores the potential risks to investors if simply choosing to passively invest via the benchmark Index. Look no further than the so-called "Mag 7" - which constitute more than a 30% weight.

Equal Weight ETF to see Mean Reversion

The euphoria in markets continued last week - with the S&P 500 notching a new record high - taking out the 4817 high from Jan 2022. Thanks largely to the Fed signaling peak rates in combination with inflation trending lower - markets now believe a 'soft landing' is possible. That is, inflation ultimately trends back to the Fed's objective (2.0%) without any negative impact to the broader economy (e.g. widespread job losses). We will see how that turns out - as the Fed is attempting to thread a narrow needle. From mine, a soft landing remains a lower probability outcome. However, I believe there is still opportunity... and it's not with large cap tech stock.

Investors Start Weighing the Risks

Investors have hit pause on equities - evaluating a new set of risks. For example, the S&P 500 is now trading close to the same level it was at the end of January. 8 months of gains gone! The world's largest index is up ~10% year to date... losing 2.4% this week. When you consider the S&P 500 lost ~19% last year.... it has not been a good two years. This post looks at why the outlook has deteriorated with 4 key charts: (i) 10-year yield; (ii) 10-2 yield curve; (iii) VIX; and (iv) gold - which touched $2,000 this week. What does it all mean?

Rethinking Asset Allocation

Last week we were treated to another thought provoking memo from Howard Marks. Apart from Warren Buffett and Stan Druckenmiller - very few investment managers boast a better 40+ year record than Marks. These investing legends rarely speak. But when they do - pay close attention. Marks' note was follow-up to his previous memo titled "Sea Change". Here's the TL;DR: investors need to re-think their longer-term investment strategies. He is of the view the next decade (or more) won't be the same as the last. A rising tide is unlikely to lift all boats. However, this also brings meaningful new opportunities for double-digit returns. We just need to start looking in different 'pockets'.

The One Chart that Matters Most

If you were asked what is the most important metric in global finance - what would you answer be? The S&P 500? The US Dollar? Gold Something else? My answer is the US 10-year yield. Everything in finance is a function of this asset. For those less familiar with the game of asset speculation - this is a very important concept to understand. What's more, its importance extends well beyond the stock market. To begin, the US 10-year yield is the proxy for financial instruments such as your mortgage, your car loan, student debt, your credit card etc. More than that - how this bond trades also signals investor confidence.

Think About Adding Bonds

For me, 2023 has been a year of repositioning and managing risk. I lowered my exposure to large-cap tech (down to ~20% portfolio weight) and increased exposure to banks, energy and some industrials (which all trade at reasonable valuations). Today I will look at two bond ETFs - which I think could warrant exposure in your portfolio. In summary, with the US 10-Year yield back above 4.0% - it pays to add some longer-term duration.