 Near-Term Bounce – Followed by Retest of Lows
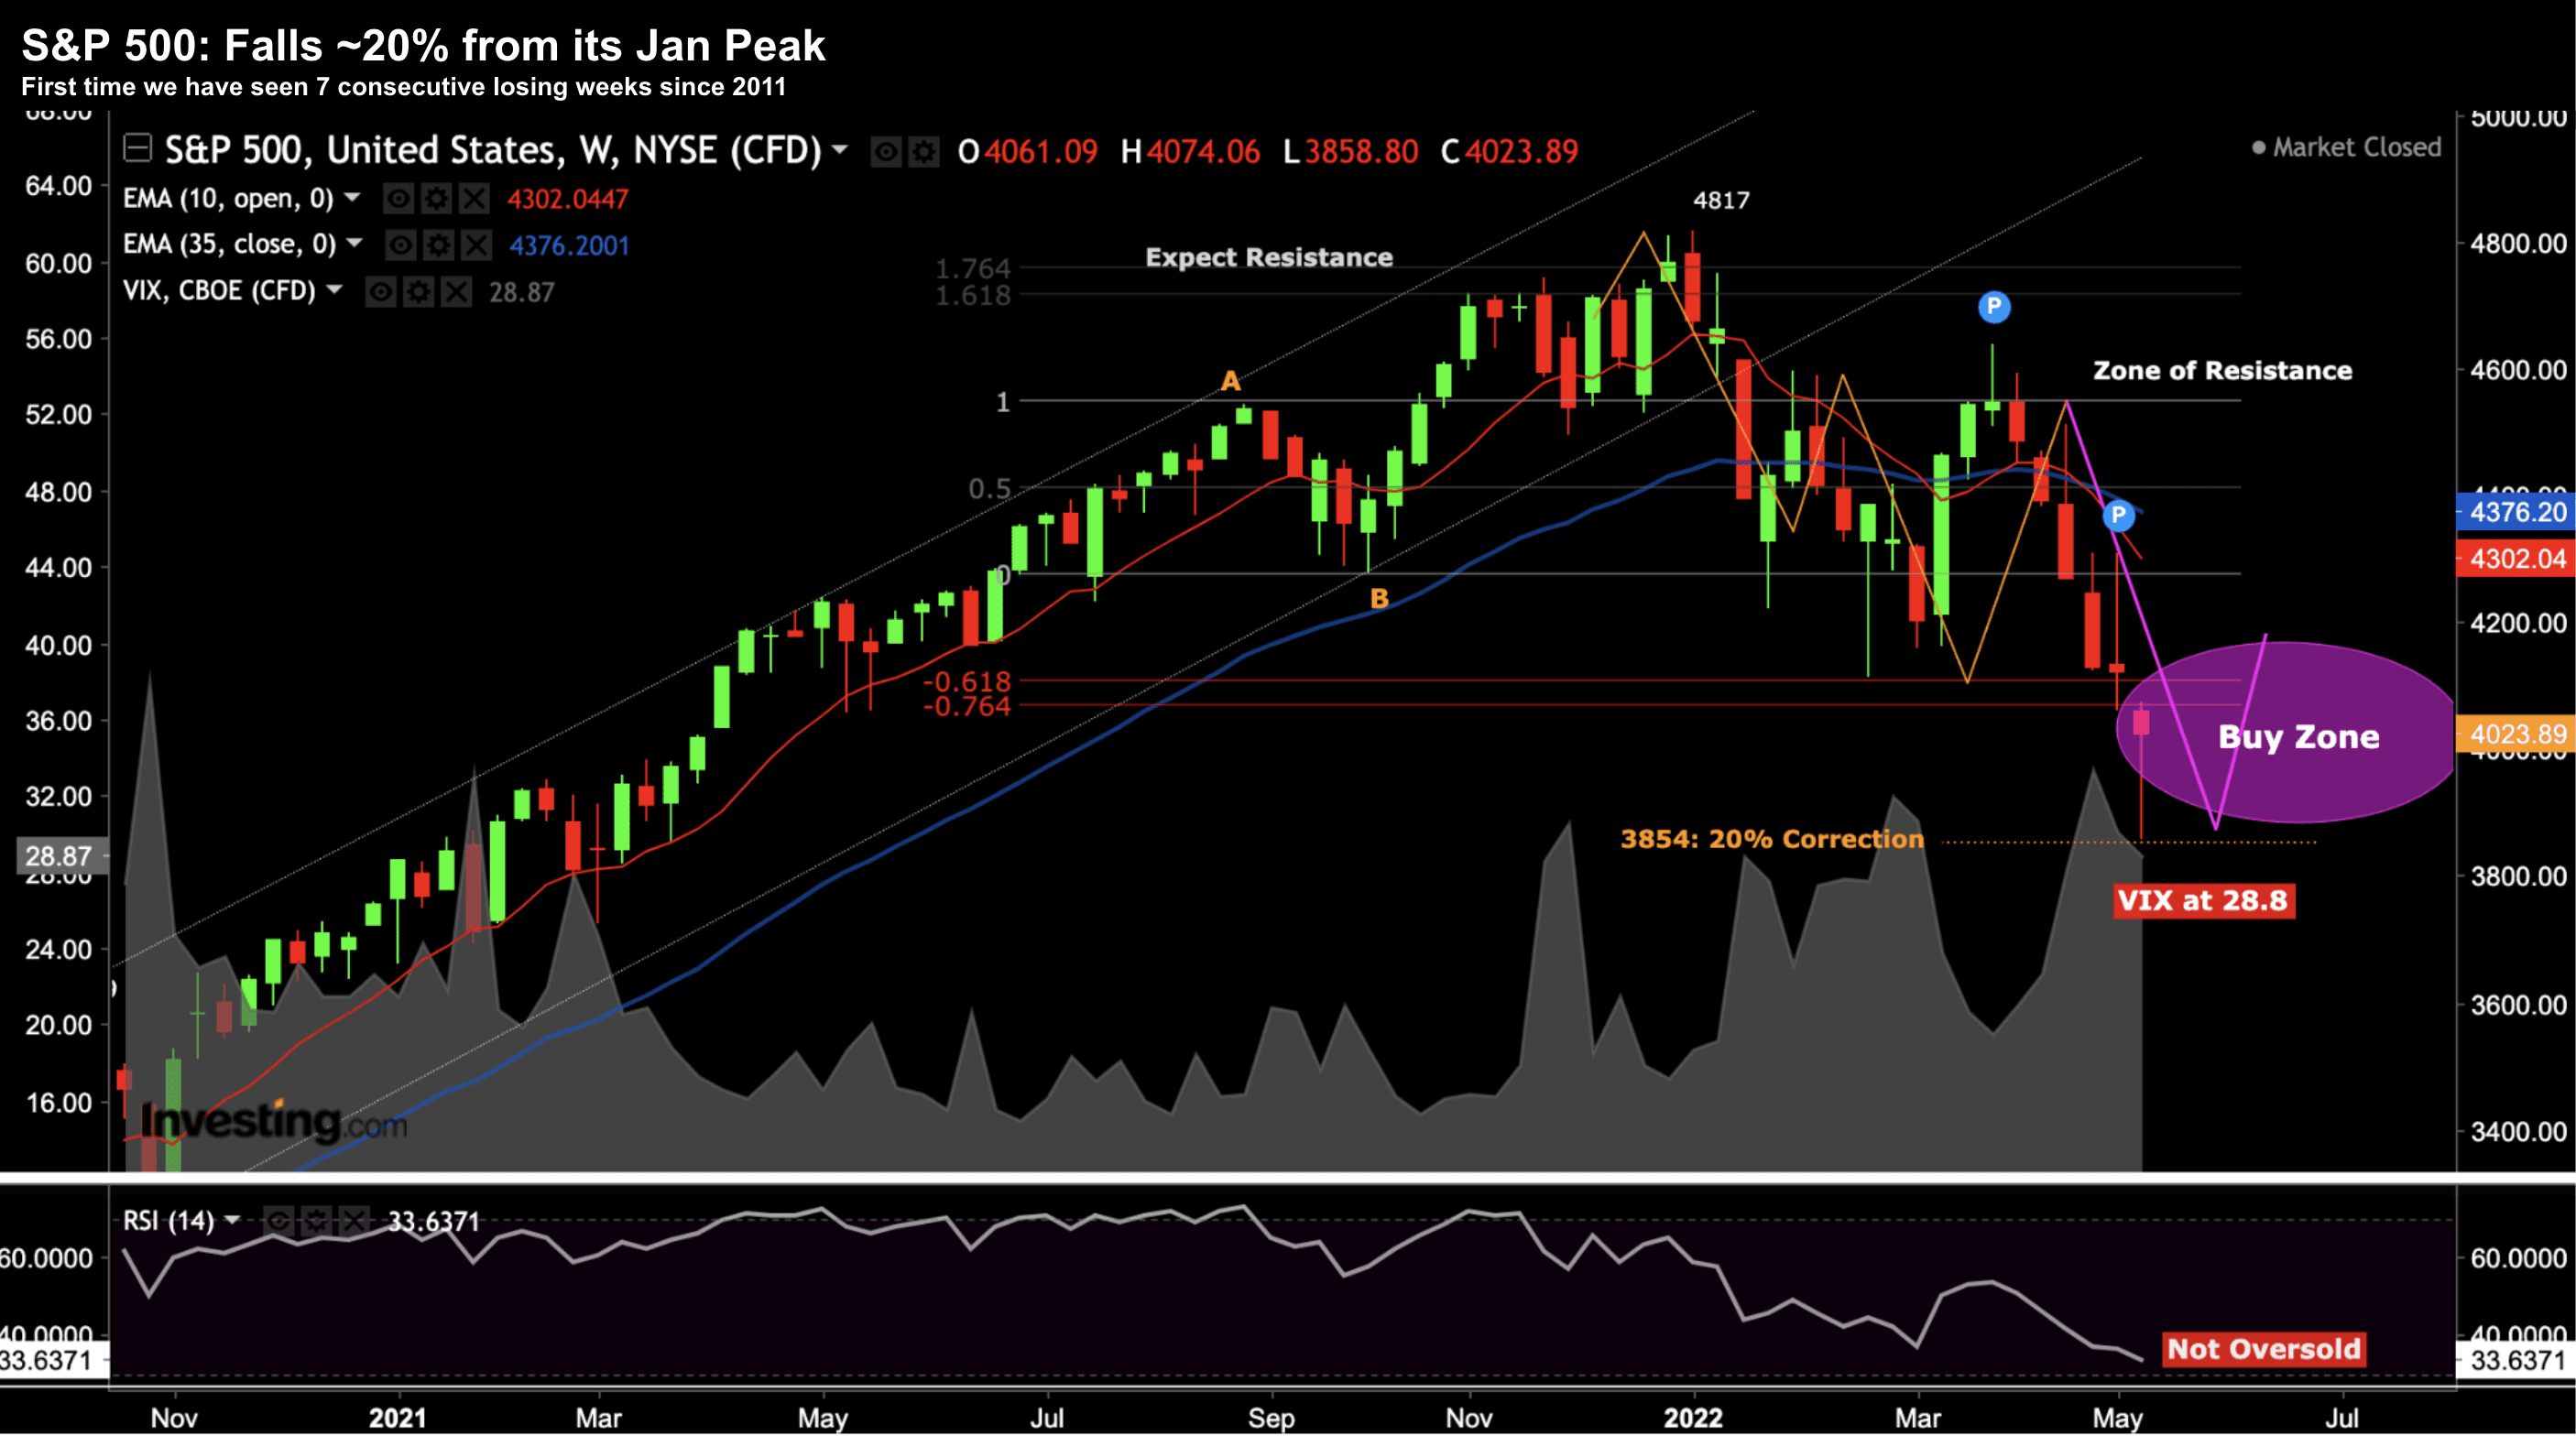
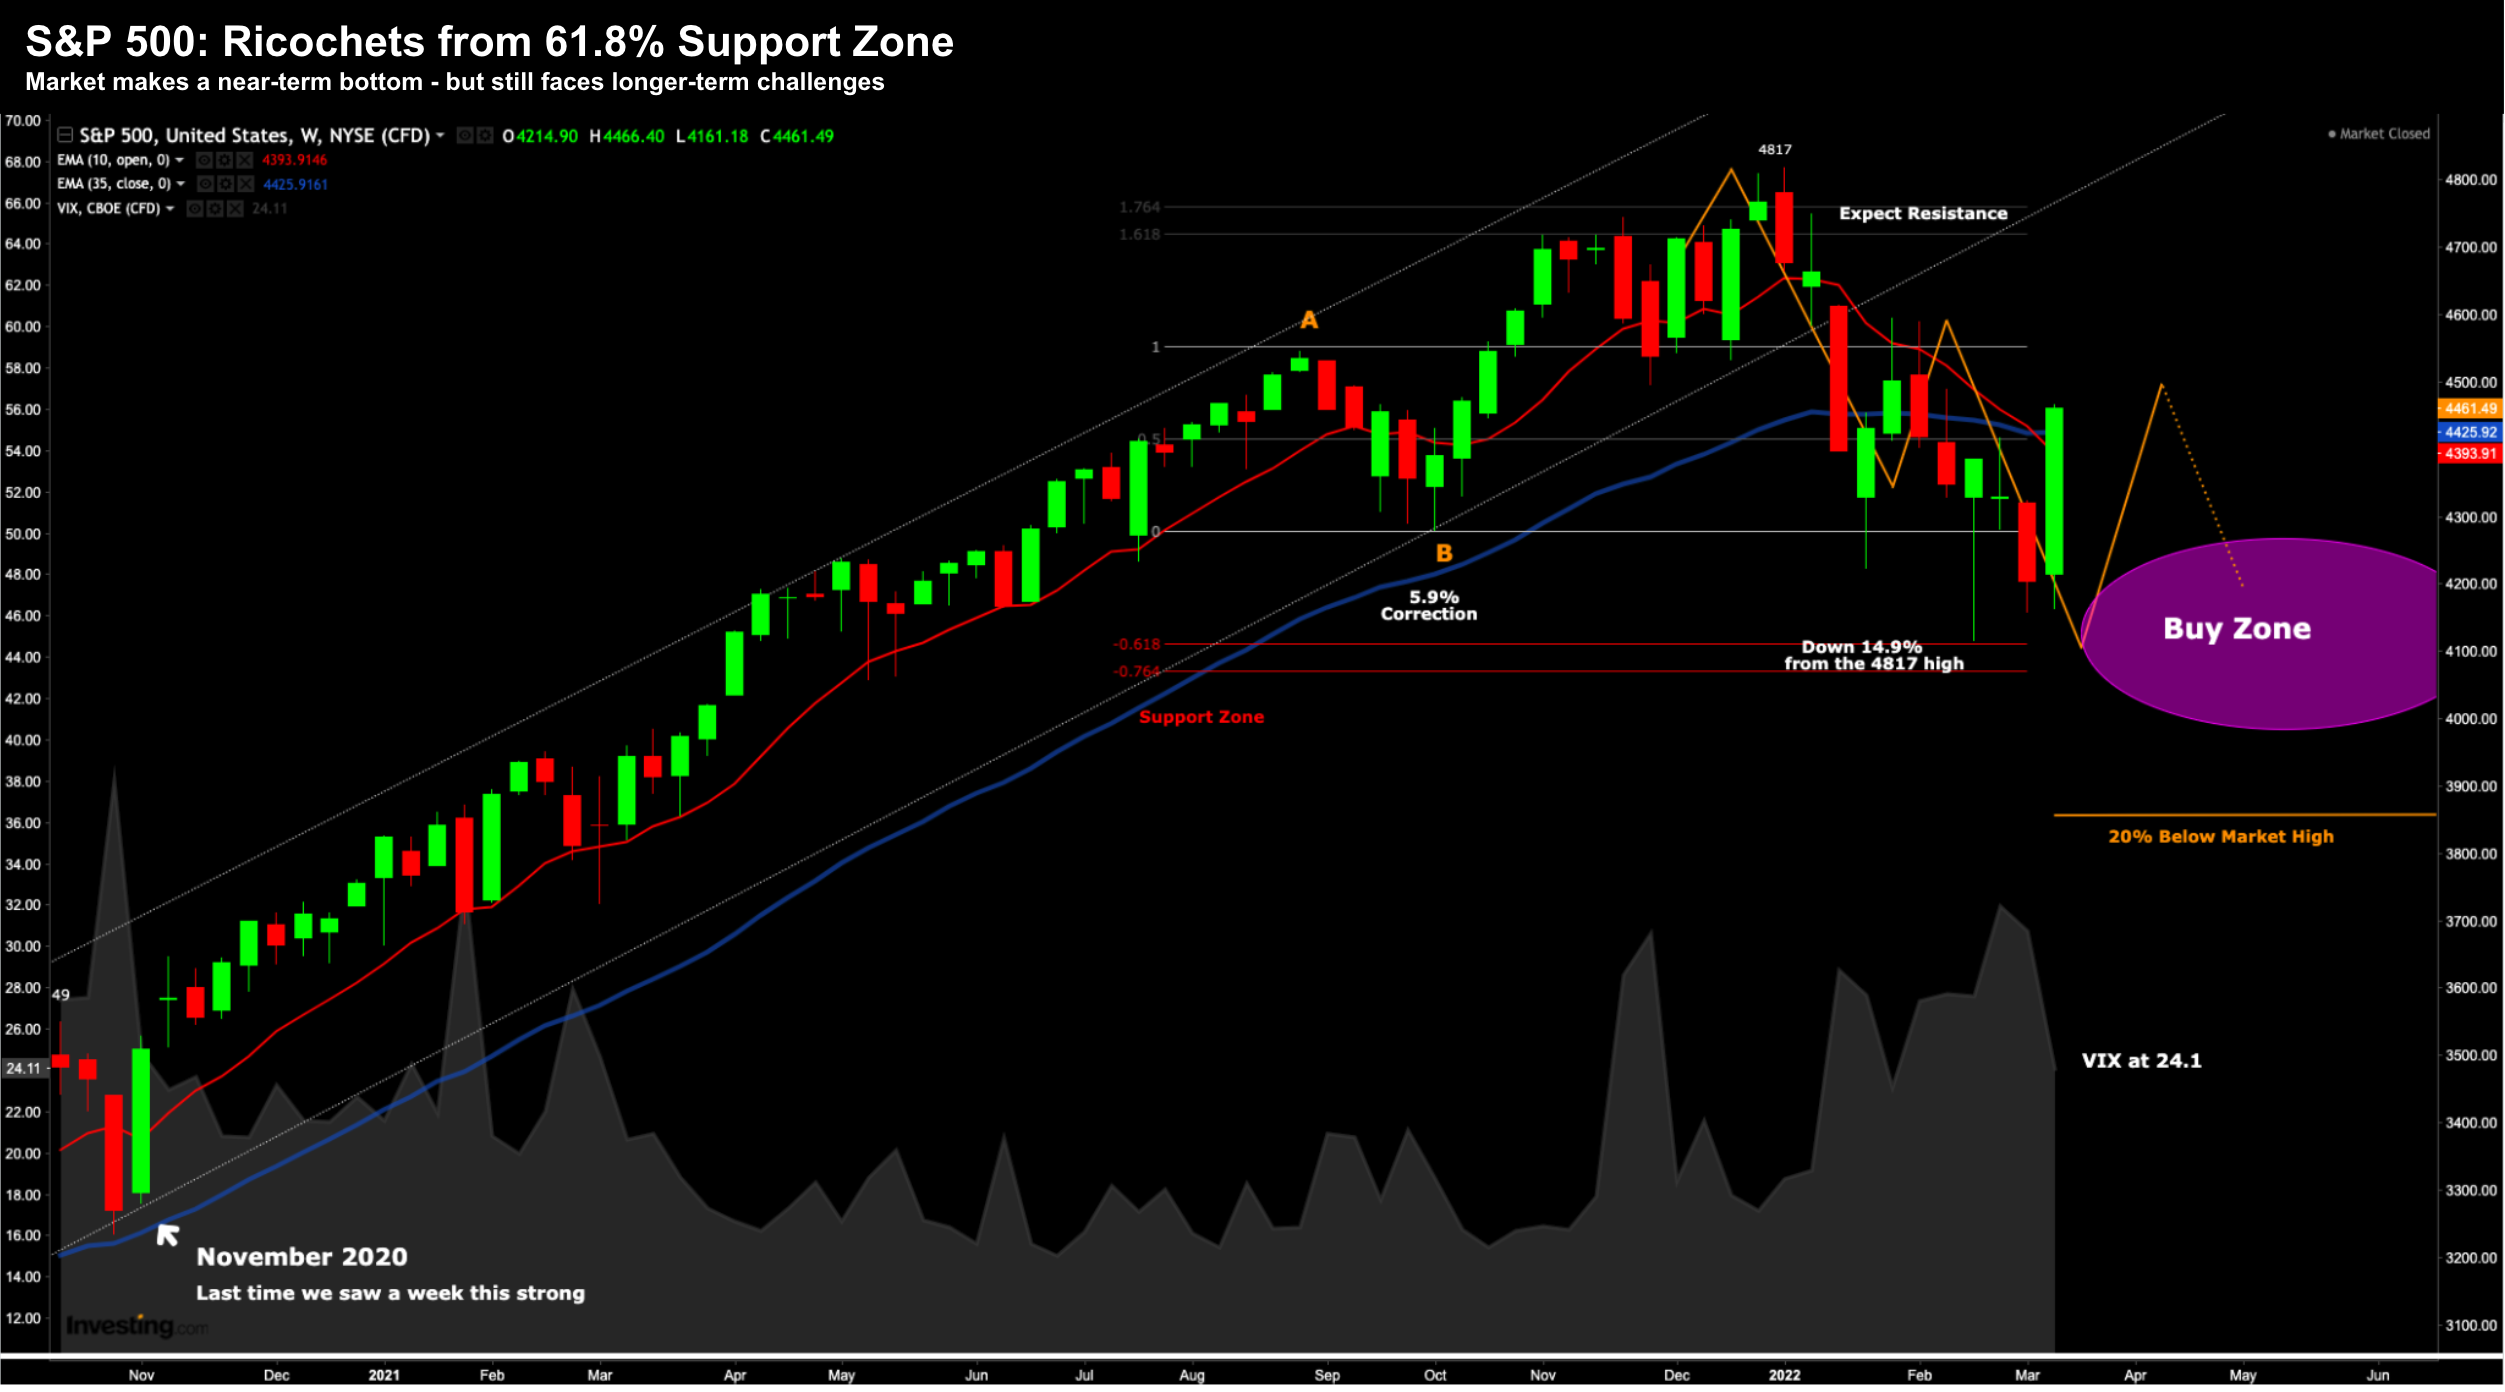
With the S&P 500 trading a smidge below 20% off its high this week... and the Nasdaq firmly in "bear market" territory... it's my view that equities represent far better risk/reward than they did earlier this year. In fact, some are as attractive as I've seen in over a decade (and why I added to select positions this week)