Category Recession

Are These Recession Indicators Broken?

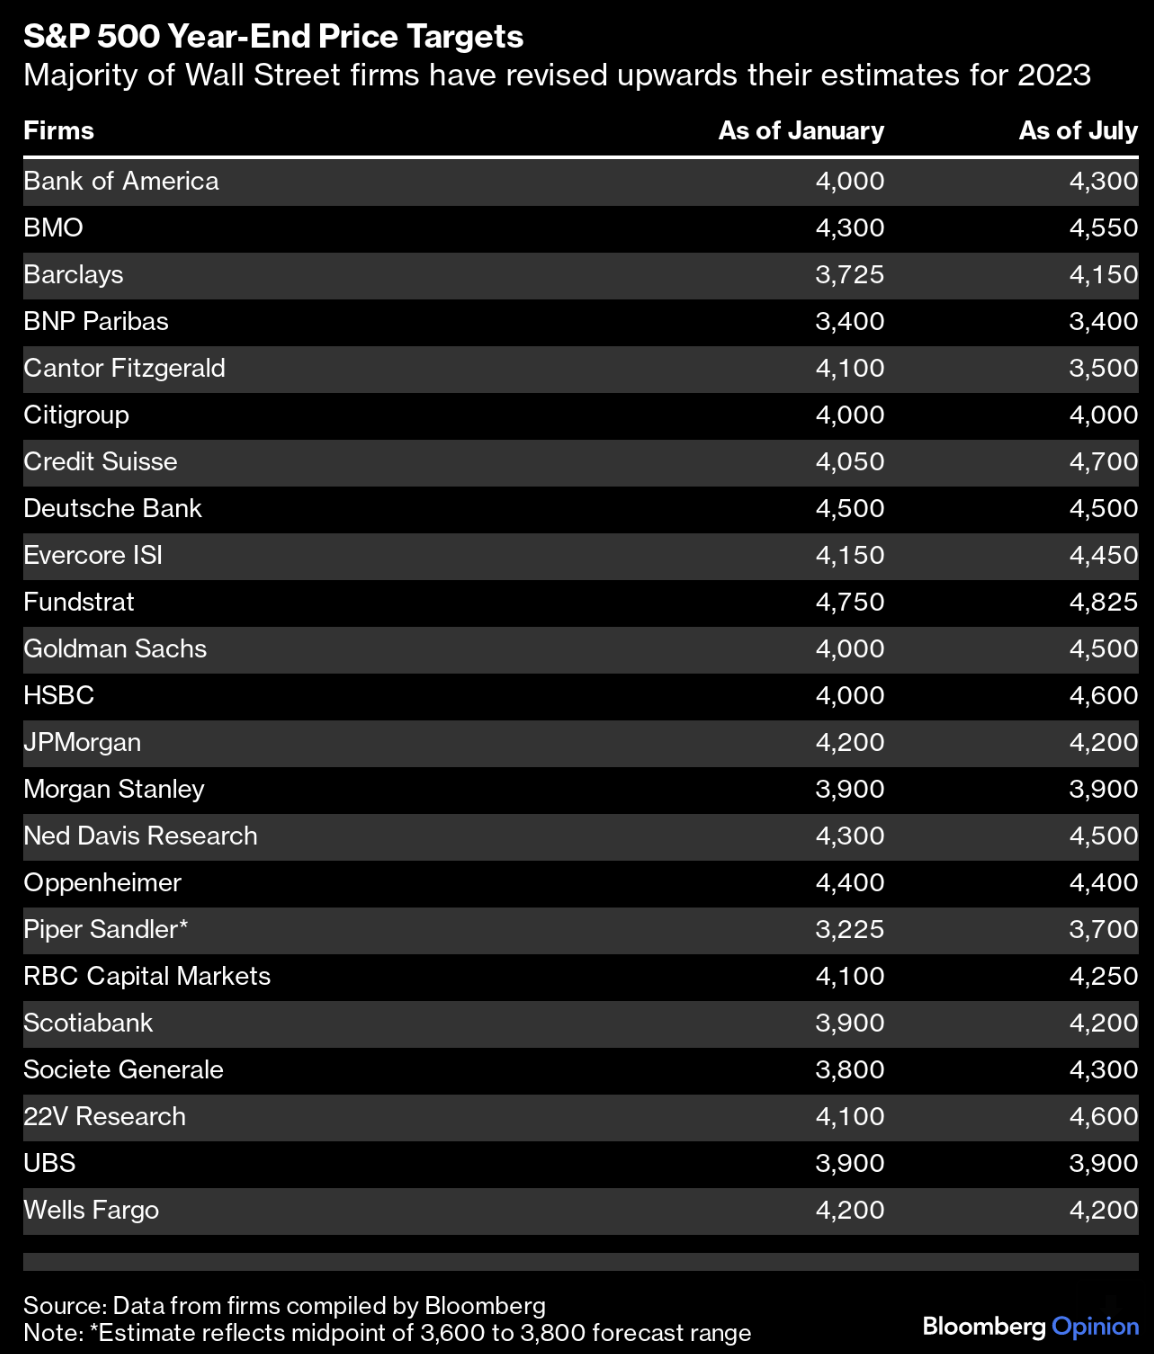
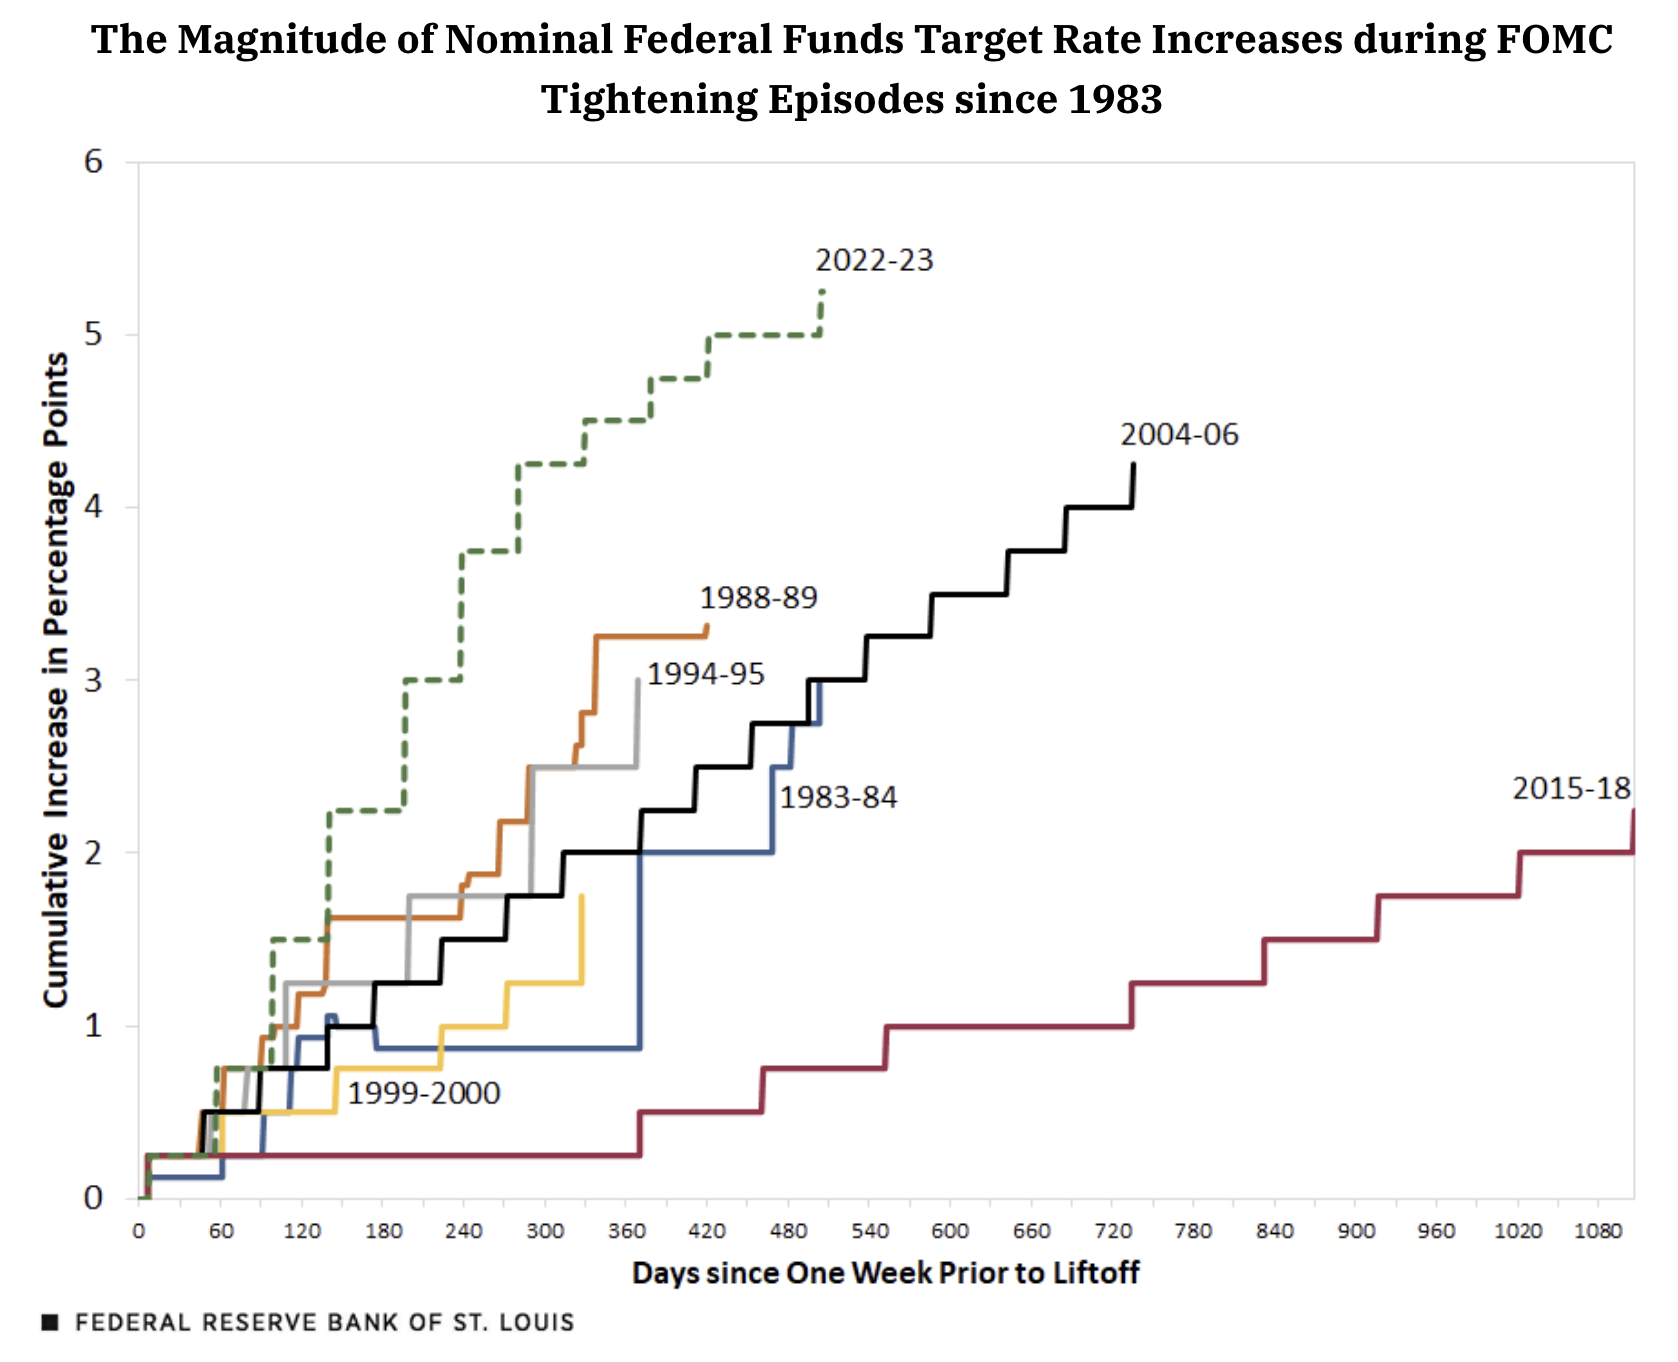
At the conclusion of their July 26 '23, meeting, the Federal Open Market Committee (FOMC) voted to raise the target range of the federal funds rate by 25 basis points to 5.25% to 5.50%. The S&P 500 traded around 4,000 points at the time - some 16% off its ~4800 January high. Markets had reason to be worried... Investors had not seen the Fed this aggressive at any time in the past 40 years... and conditions seemed ripe for a recession. What's more, most widely cited indicators suggested this was a likely outcome. However, it didn't happen? Why not? Are popular recession indicators no longer relevant?

Don’t Fight the Fed…

"Don't fight the Fed" is a popular Wall St. adage for investors. The phrase was coined by well known investor Marty Zweig in 1970. At the time, Zweig explained the Federal Reserve policy enjoys a strong correlation in determining the stock market’s direction. Fast forward ~50 years and his theory has proven mostly correct.

Why I’m Not Betting on a Soft Landing

With the Fed seemingly on pause and bond yields sharply off their highs - markets are optimistic. Equities have surged the past few weeks - up around 17.6% year-to-date. The S&P 500 added 10% in just 3 weeks! The narrative (as far as I can tell) is we're headed for "soft landing". But can we be so sure? Past experience suggests a "hard landing" is the more likely outcome. And absent other evidence, when the Fed hikes this much (and especially this fast) - we should expect one.

Are Bond Yields and Oil Cracking?

Today was an important day in the bond market. The US Treasury auctioned $40B of 10-Year notes. Coming into the auction - I was worried there would not be a decent bid. For example, if we faced further buyer's strike - these yields were likely to resume their path higher. However, we saw the opposite. The 10-year yield drifted lower. So what does this tell us about future economic growth? Are investors worried? In addition, the price of WTI Crude is also sharply lower... back below US$80/bbl on concerns of weakening demand. Are equities slow to connect the dots - as they are headed in the opposite direction.

For Now, A Slowing Economy is Good News

A weaker than expected October payrolls print sent stocks flying and bond yields sharply lower. The S&P 500 finished at 4358 - a whopping 5.9% for the week. It was the market's best week for the year. Renewed bullish enthusiasm was mostly due to investors betting the Fed is done. And that makes sense. For example, if employment, growth and inflation continue to soften - there's every possibility the Fed has hit its terminal rate. However there is a caveat. Not only will the Fed need softer economic data - they are hoping the bond market continues to keep financial conditions tight (i.e. bond yields stay high)

Are Recession Callers Back-peddling?

It's the rally everyone loves to hate. Why? Because very few got it right. Most fund managers missed this rally entirely... thinking it was only a matter of time before things collapsed. The thing is - they haven't. I will admit - I also got this wrong. My initial target at the start of the year was 4200. If that broke - I was looking at resistance around 4500. The S&P 500 now trades 4536 - making me look foolish (and it won't be the last time I am sure). We're now just past the mid-point of the year - with the S&P 500 up 18.2% YTD. Remarkable by any measure. What are Wall St saying about the second half?

Can Consumers Continue to ‘Shop ’til they Drop’?

Never underestimate the US consumer's willingness to spend. And from mine, that's been the story of this year. Consumers have used whatever means available to spend, spend, spend. With ~70% of US GDP consumption based - that has also meant the economy managed to keep its head above water. But what does it look like going forward?Do consumers still have ultra-strong balance sheets to keep it up? And are rates eventually going to bite? I ask this because if US consumers are closer to maxing out their credit cards (with more than $1T in debt)... the odds of a recession sharply increase.

Why Is it Different This Time?

Whenever history looks like repeating - it's worth asking what's different this time? I say that because the past is never a guarantee of what's ahead. Put another way, if you are making decisions on that basis, you might be suffering from "confirmation bias". And that can be a blind spot. My (possible) blind spot is I think a recession is more than likely within the next 12 months. As such, I am only willing to put about 65% of my portfolio in risk assets. If I felt a recession was not likely - I would meaningfully increase my exposure. My bias is to lean into historical data (and leading indicators) which have reliably predicted recessions in the past. That feels logical. But I could be wrong.

S&P 500 Meets Resistance

There's a few good reasons to be bullish: (i) Q1 earnings were better than feared; (ii) Bank deposits have stabilized; (iii) Inflation is slowly (but surely) working its way down; (iv) The Fed is closer to its terminal rate; and (v) We're yet to see any major deterioration in credit. All of those are positives for risk assets. However, stocks have run a long way fast and are due to take a pause. I think that's what we will see...

Excess Liquidity Still Present 

Many people seem puzzled as to why the market continues to trade higher. For example, some readers have told me they missed the rally - wondering why things have not completely unravelled sooner. They've chosen to sit things out for one reason or another. And that makes sense... I'm sure they are not alone. Why are markets defying gravity? And how long could it continue? The short answer for a while yet. And the driver is liquidity.