As an investor, your job is to carefully assess the risks against the rewards. A large part of that equation is knowing exactly where we are in the business cycle. For example, consider the following questions: (a) do you think we’re at the beginning or middle of an economic advance (with more to go)? or (b) do you think we’re about to encounter a significant change in direction? and (c) if so, is that change for the better or for the worse? Your answer is very important. It’s far better to invest (or take more risk) at the start of the business cycle vs the end. Therefore, how will make that decision? How are you able to determine where we are? I will offer a market signal which is arguably more consistent and reliable than most indicators.
Risk
Buying is Easy… Selling is Hard
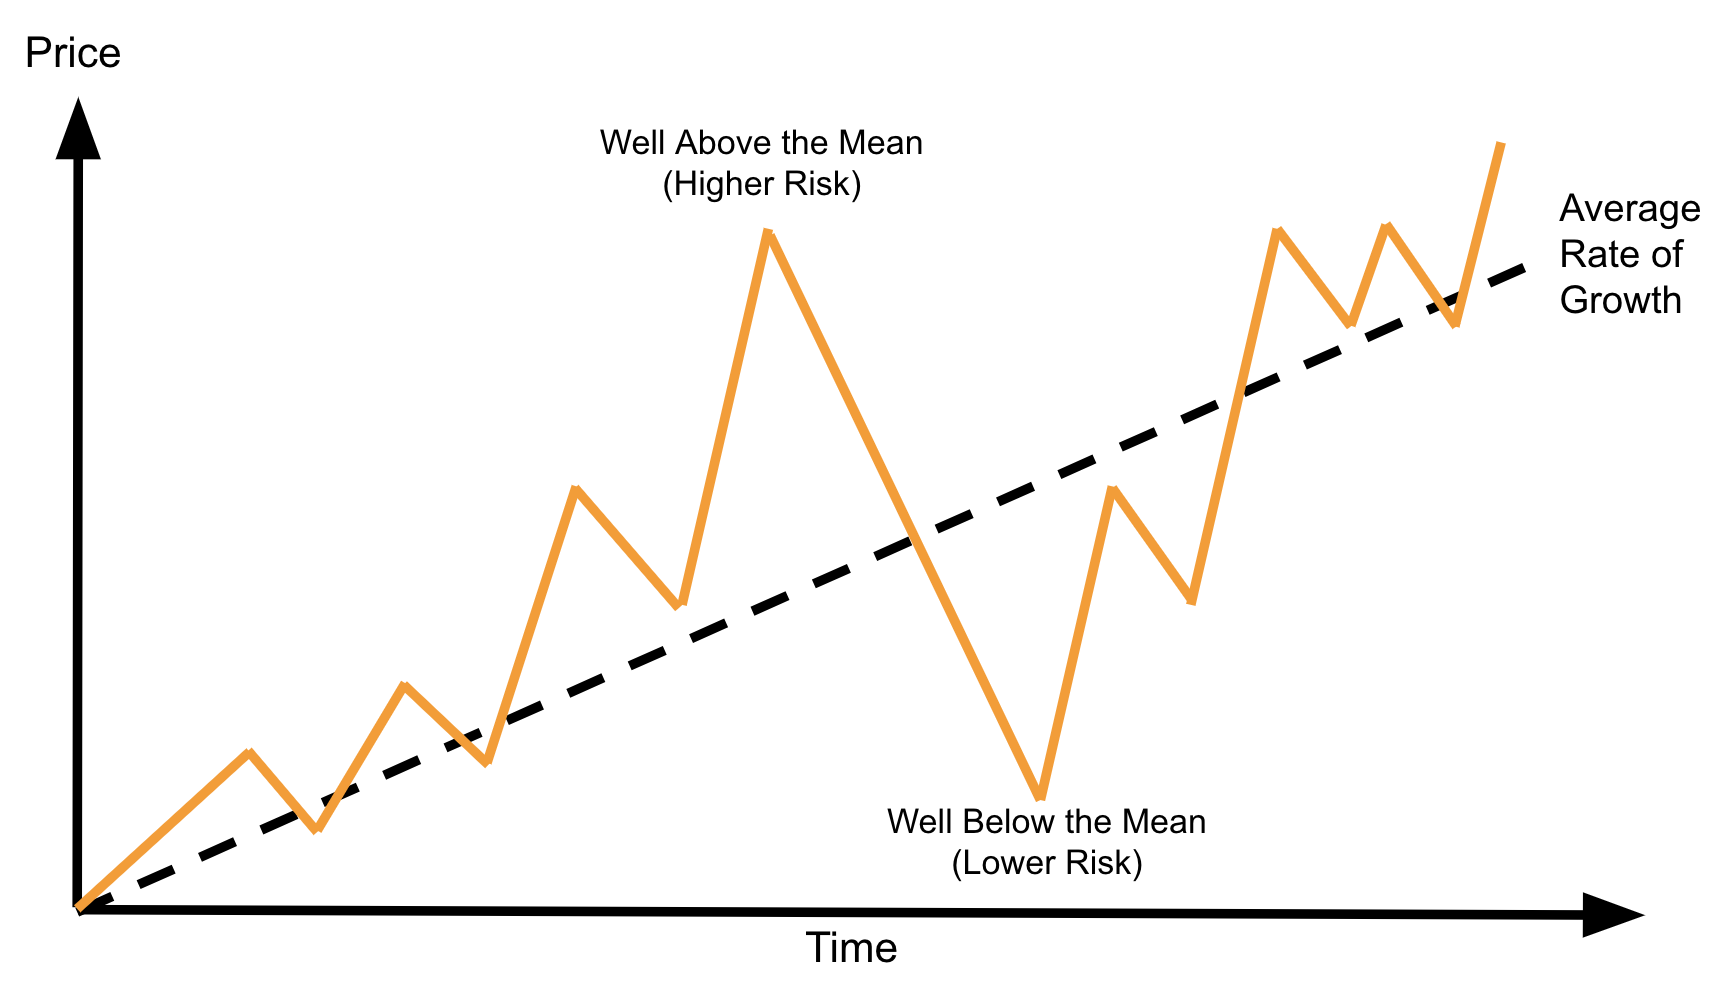
Do you consider yourself a “good” or “bad” investor? For example, one might say a good investor is someone who beats the returns of the Index over a long period (10.5% annualized). Beating the Index over the long-run is difficult to do… very few fund managers are able to do it. But what if I framed the question this way: (i) bad investors think of ways to make money; vs (ii) good investors think of ways not to lose money. Which one best summarizes your approach to speculation? Of the several thousand posts I’ve written the past 13+ years – this is arguably the most important question you could ask. If you understand the gravity of this distinction… you have a good chance of succeeding.
When the Laws of Probability are Forgotten
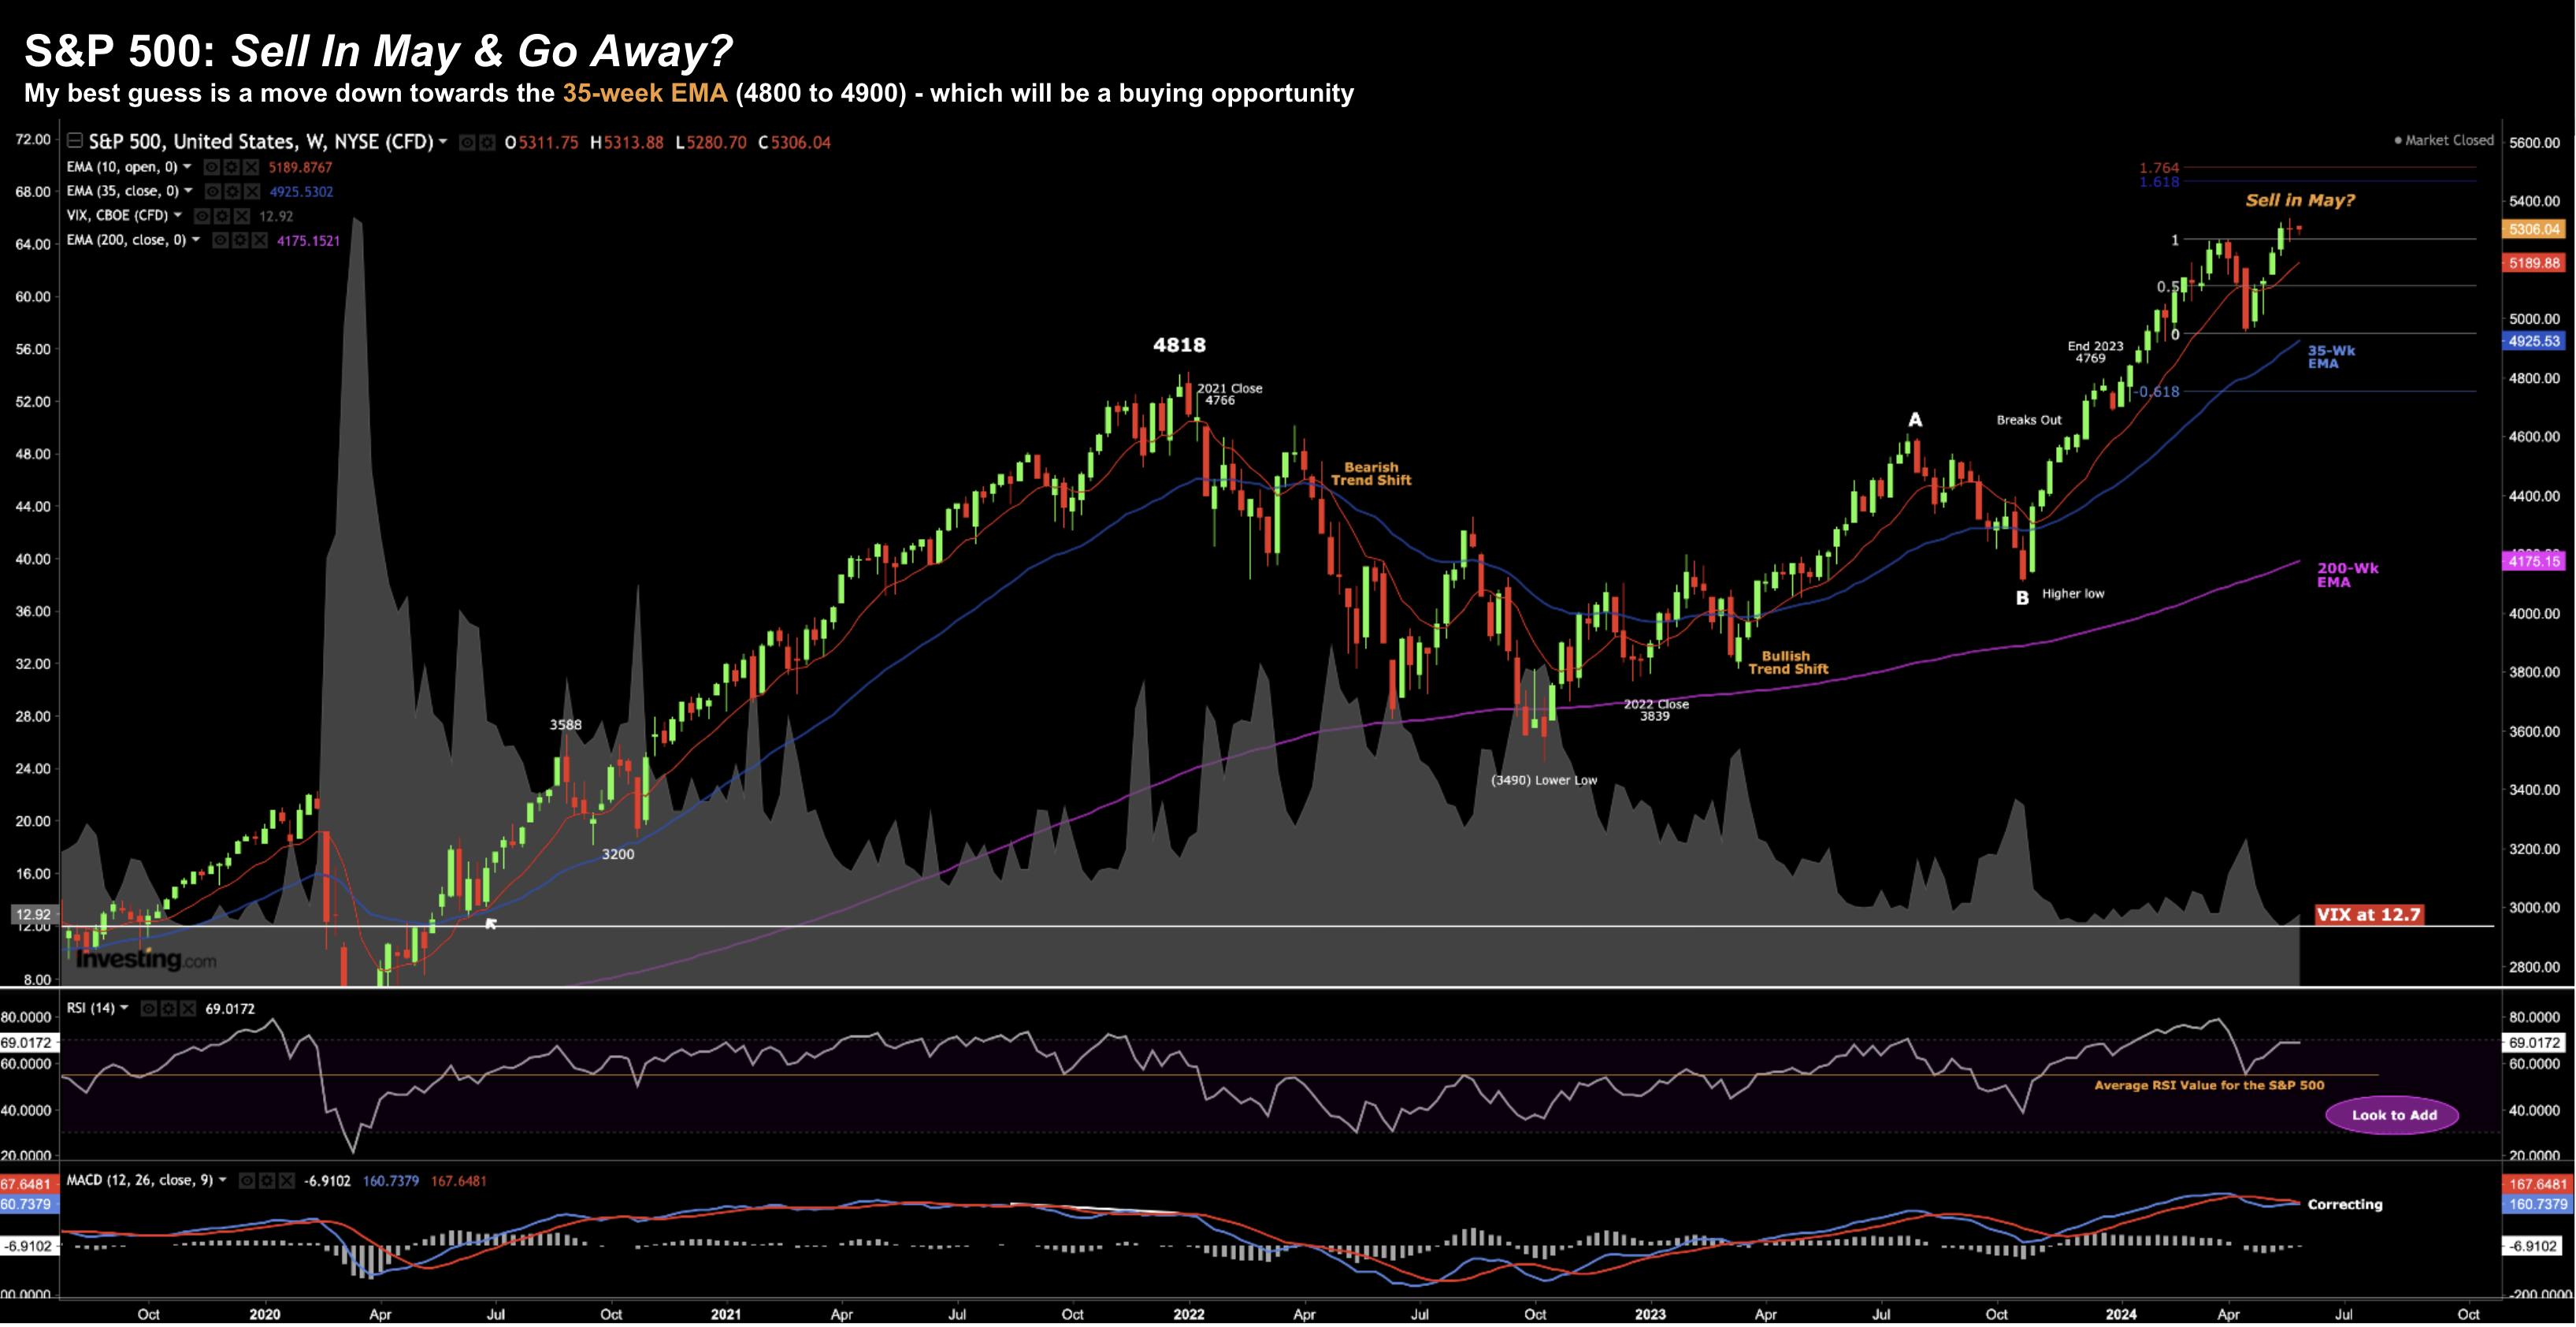
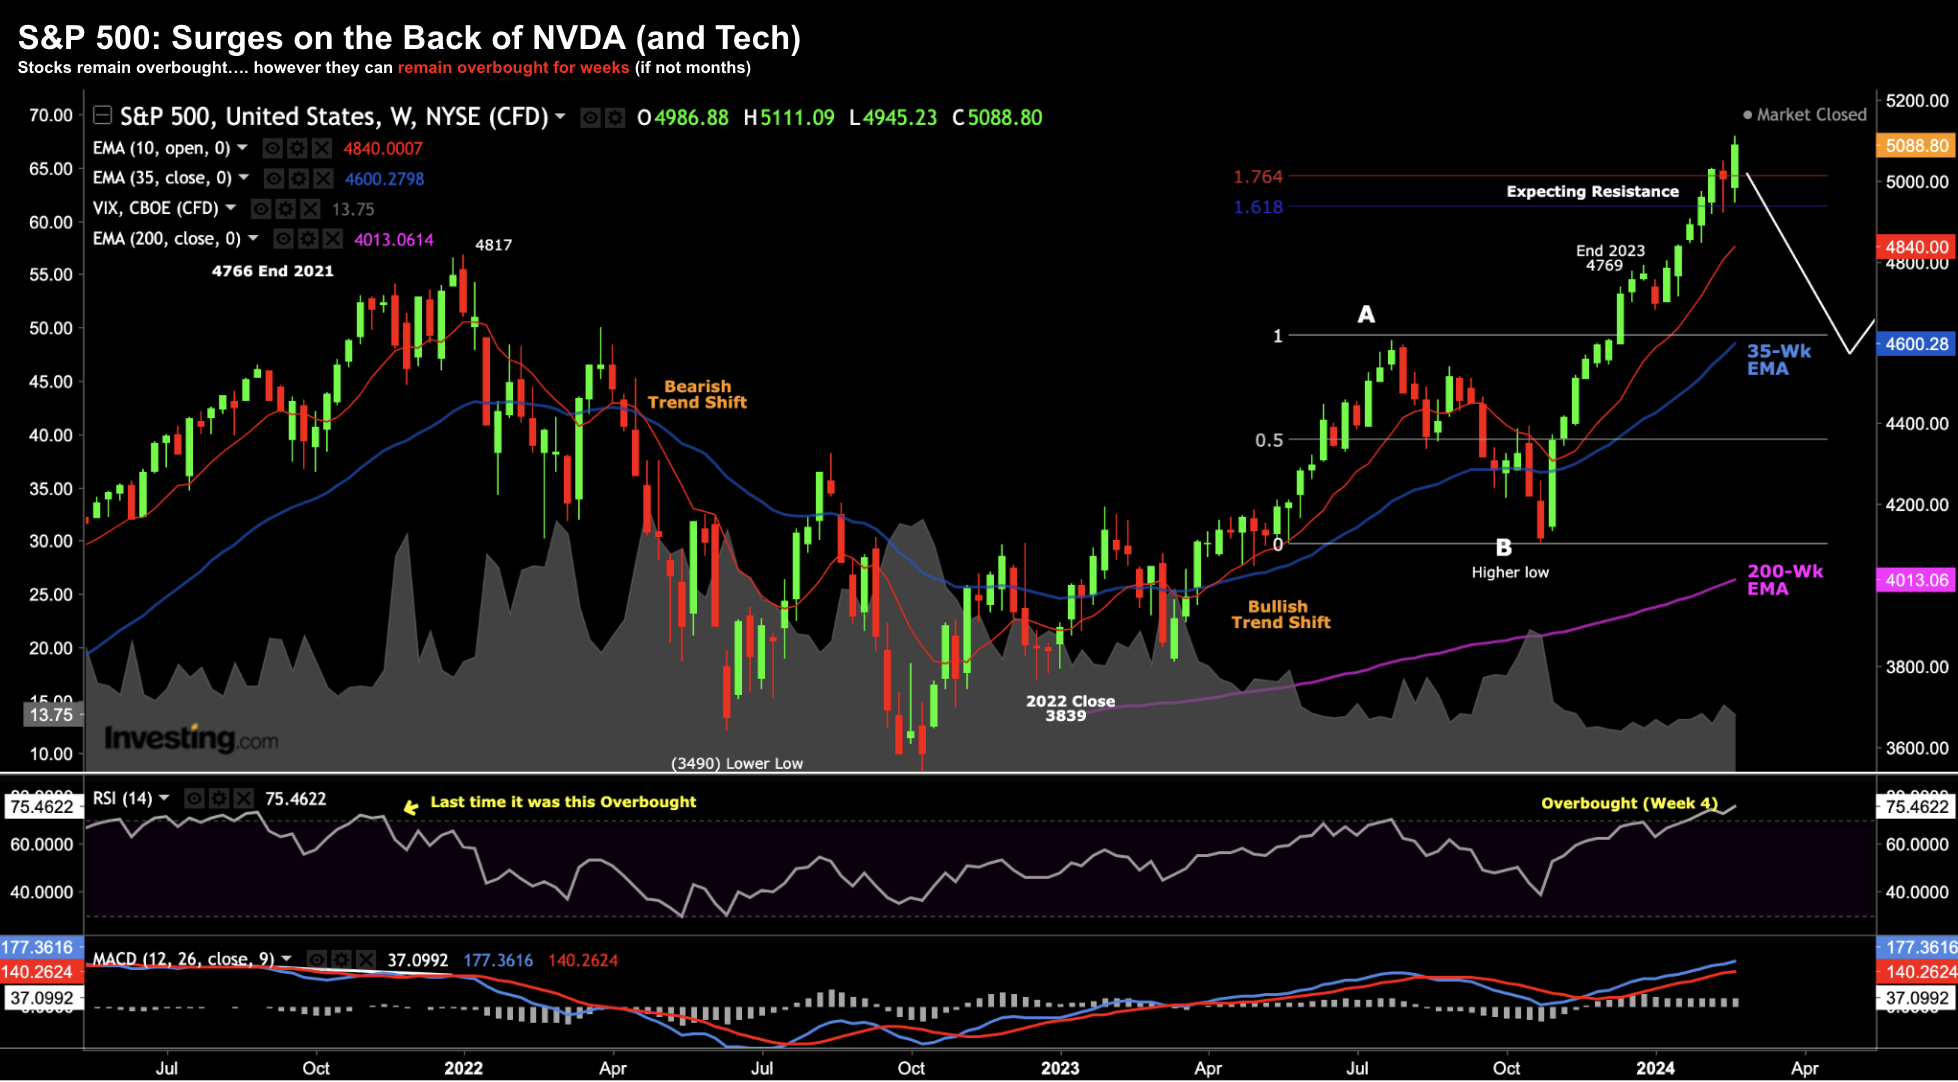
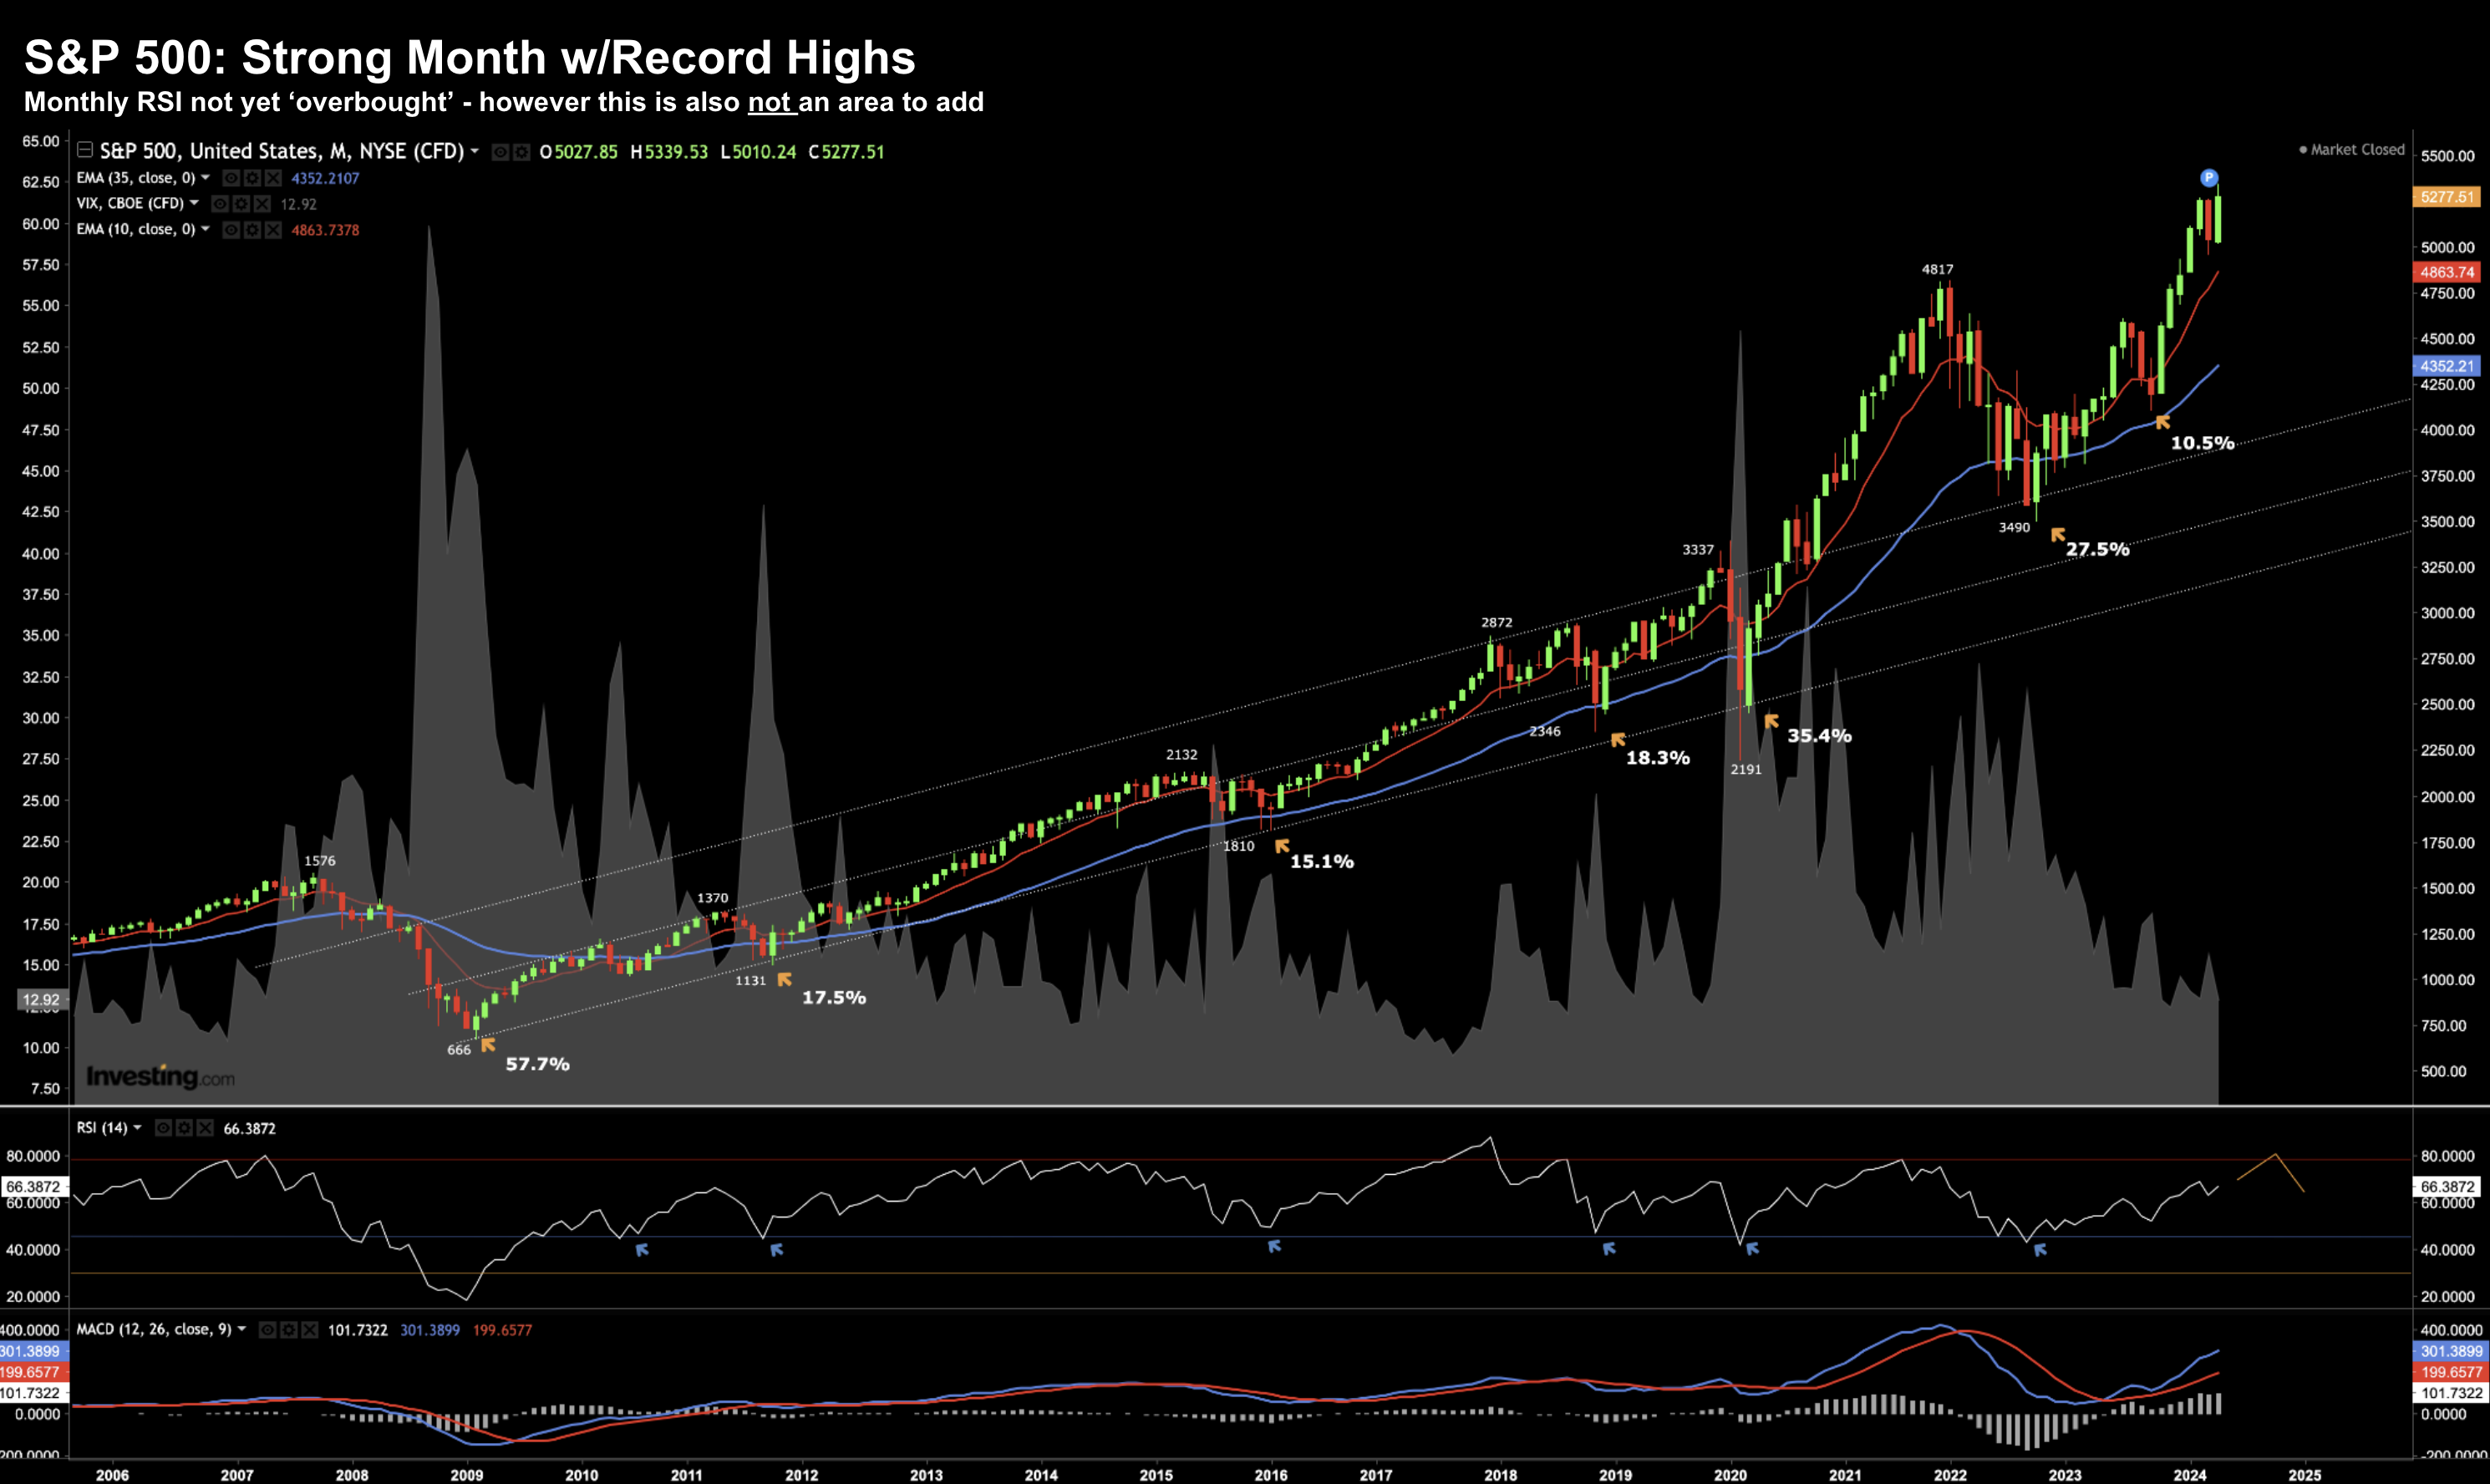
Whilst the S&P 500 posted a negative week – it was a strong month for equities. The world’s largest Index managed to add 4.8% for the month – hitting an intra-month record high of 5339. That’s four of five winning months to start 2024. Perhaps completely enamored by all things AI (more on this in my conclusion) – investors basically shrugged off sharply higher yields and a series of disappointing inflation prints to push prices higher. What could go wrong? At the end of every month – it pays to extend our time horizon to the (less noisy) monthly chart. And whilst the weekly chart is useful – it tends to whip around. Longer-term trends (and perhaps investments) are often better examined using this lens.