Market Volatility vs. True Panic: How to Use the VIX to Identify Peak Fear
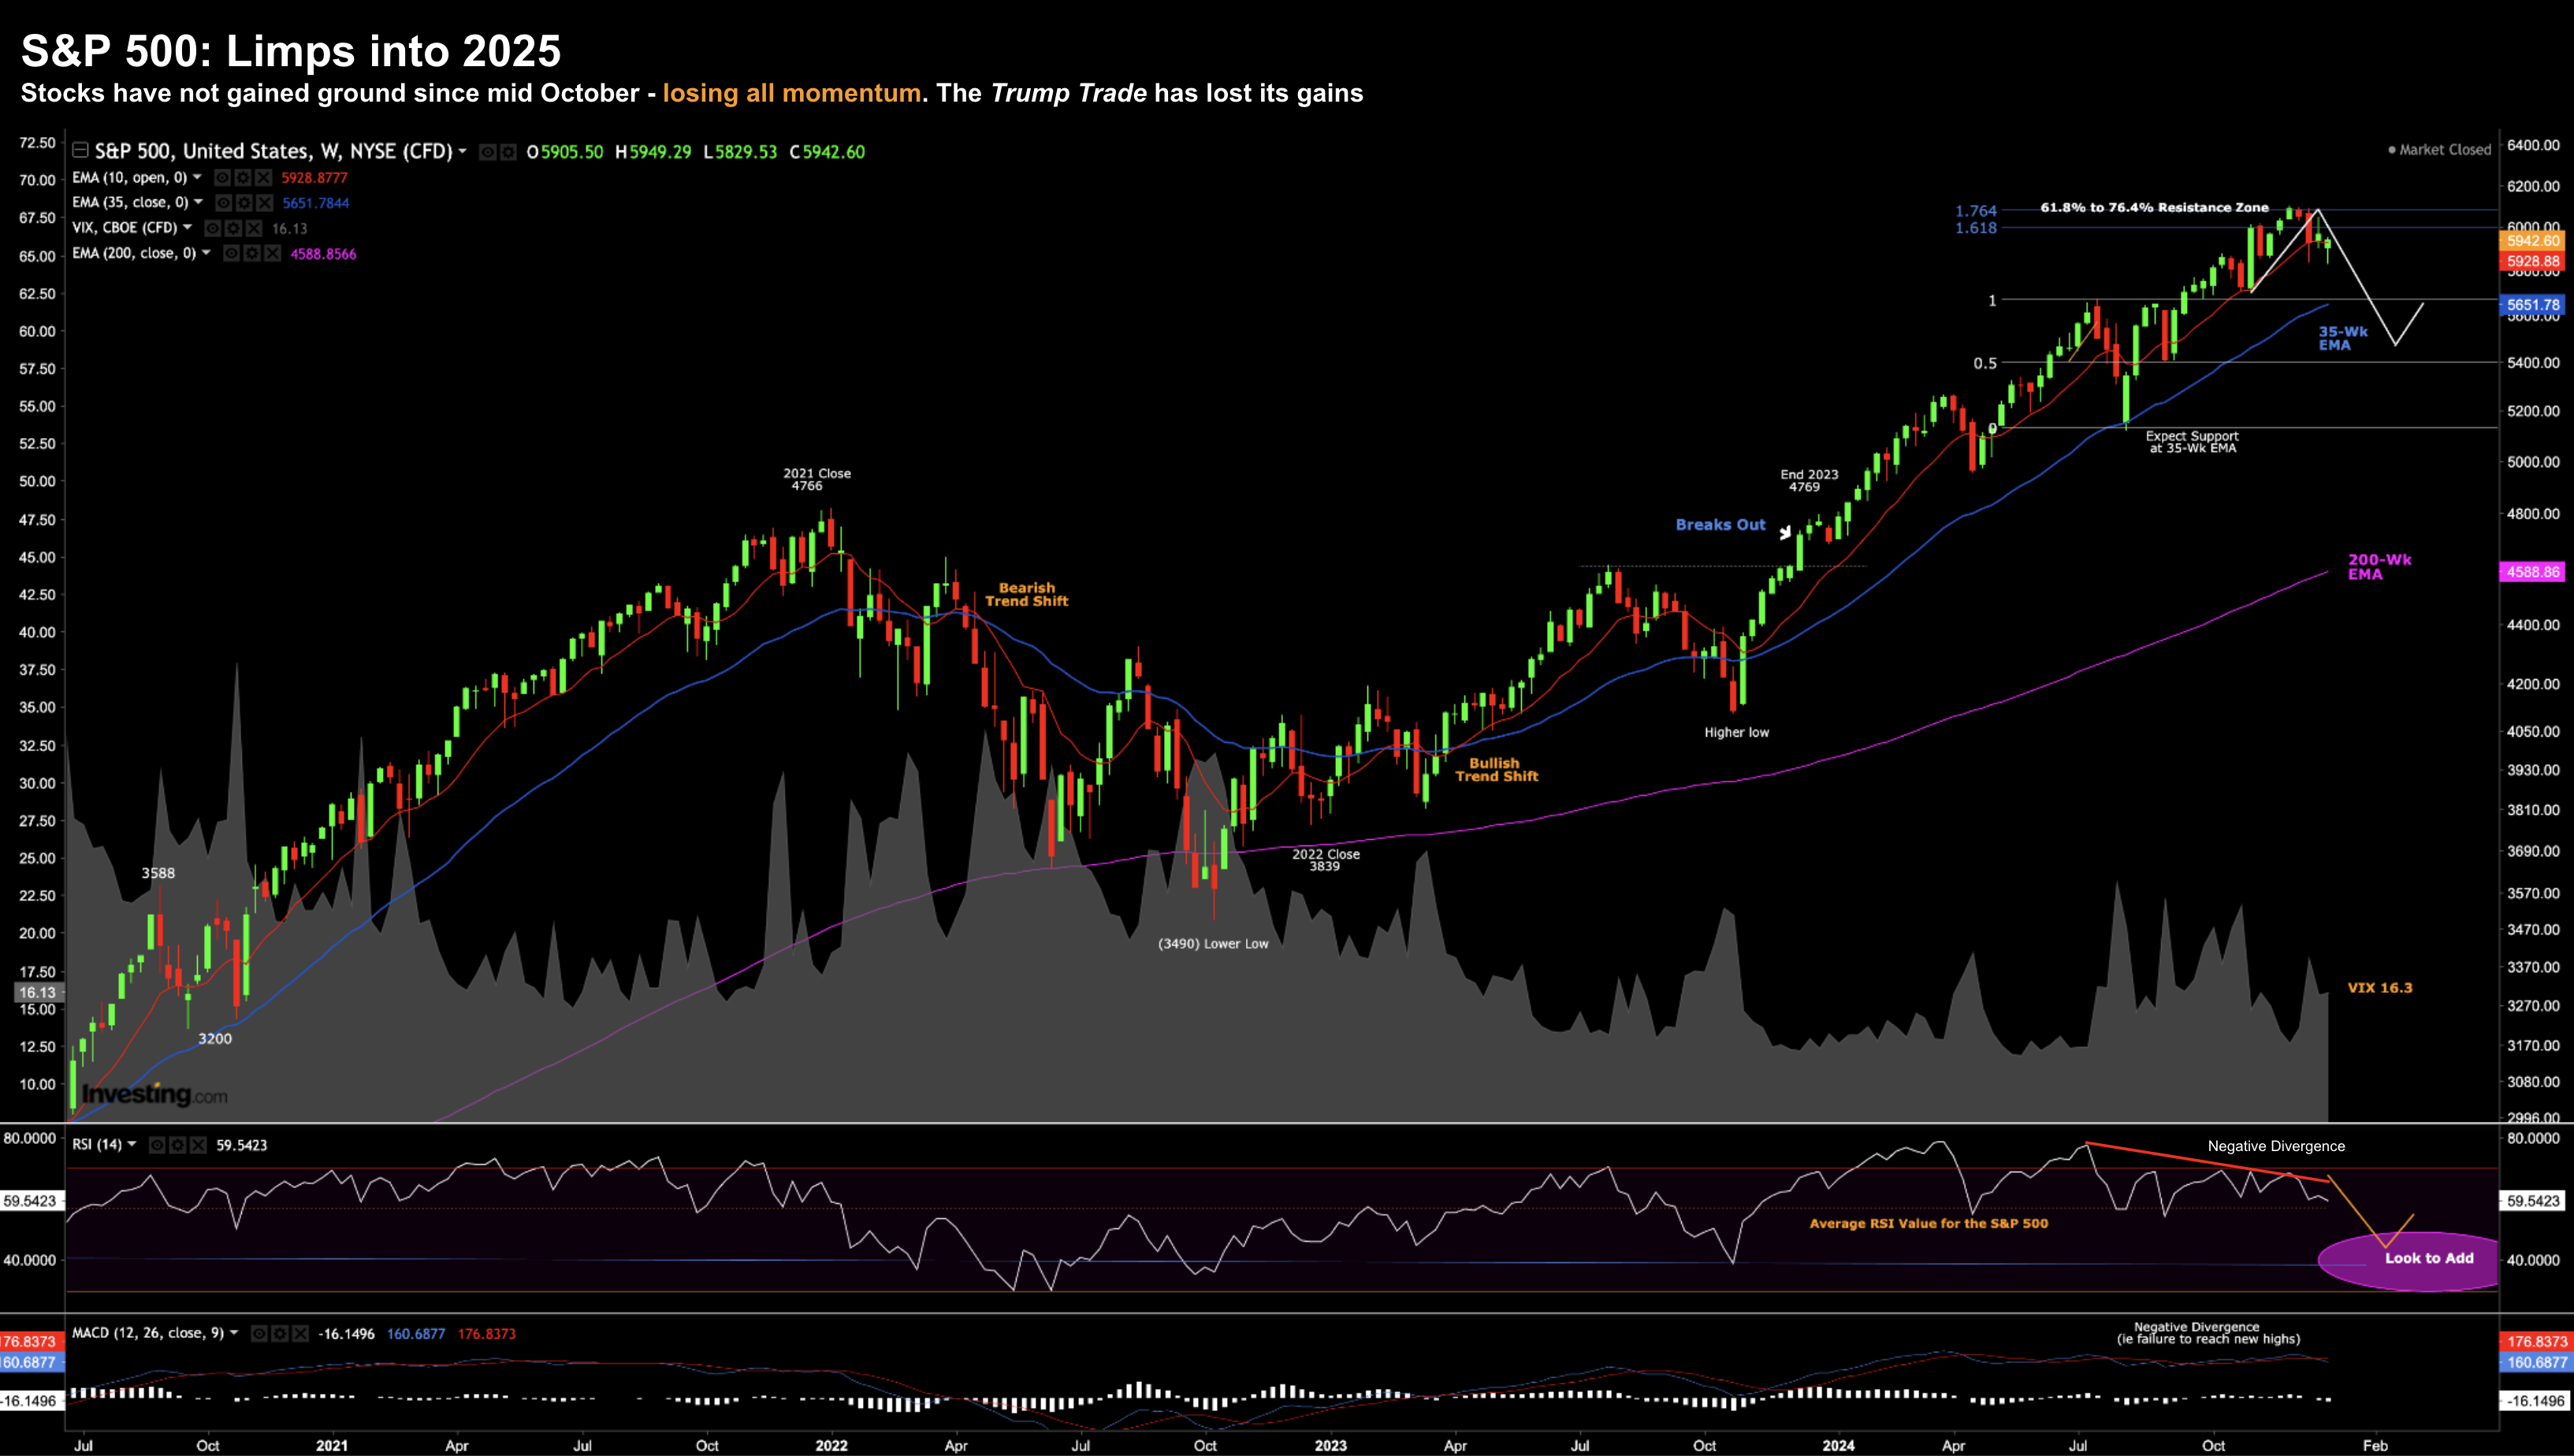
Are markets panicking? That depends on who you ask. A short-term trader might see the ~6% move lower as significant. On the other hand, those who invest for longer-term (such as myself) see a ~6% move down as nothing at all. From mine, panic isn't here yet. However, there is a measure which can help us identify when markets are overly fearful. And generally - they are great buying opportunities. But we are not there yet.