How Far Will Multiple Expansion Take Us?
Words: 1,347 Time: 6 Minutes
- The divergence between EPS and price appreciation widens
- S&P 500 monthly chart shows how momentum is fading
- Why 5,000 for the S&P 500 is not unrealistic
At the end of every month – I check in with the monthly chart for the S&P 500.
It"s not for the purpose of making an investment decision – it"s simply to gauge sentiment.
Are investors greedy? Fearful? Do they have a predisposed bias?
In general, what the price of stocks do day-to-day or week-to-week matters very little to what I do.
What"s more, it"s unpredictable and noisy.
Therefore, it"s best ignored.
A short story:
Someone said to me last week they had $35,000 to invest for a year – it was money they had saved for their wedding. They asked what they should do?
I said "assuming you don"t want to lose the money – don"t put it in the stock market. One year is far too short to know whether stocks will rise or fall. Your odds are better betting on red or black in Vegas"
They were confused…
"But hang on Adrian! I thought you followed the market. Don"t you know what stocks are cheap or expensive? I thought you would be the best person to ask?"
To which I said….
"It"s true I follow it. And yes – some may be cheap or expensive pending how you choose to value them. However, I have enough grey hair to know that any bet less than a year is simply a gamble. If you"re only looking at one-year – buy a short-term government bill paying ~4.0%".
They left disappointed.
My guess is they wanted me to say "oh – you should definitely buy Nvidia or Reddit or Crowdstrike etc etc – because it"s going higher".
Now if they said their minimum holding timeframe was 3-4 years – I could offer a few suggestions.
But it brings up a few important points on timeframe and price action.
Just because the price goes up or down over a few days (or weeks) has zero bearing on what may happen in the future.
Here"s an analogy:
If I flip an evenly weighted coin – and it lands on heads ten times in a row – you might think it"s very likely the next flip will be tails.
Right?
This holds because probabilities suggest it"s unlikely to flip eleven heads in a row.
Consider the odds – this is 1 in 2048 event!
Here"s the math:
(1/2)11 -> 1 / 2048 -> 0.0488% (i.e., 1 in 2048)
However, it"s equally true the previous coin flip has zero bearing on the next.
They are entirely independent events. They coin does not what it flipped previously.
One toss has no bearing on the next.
And yet – there will be some who are convinced the previous "ten" flips has some weight (and bet heavily on it).
Note: this is why casinos put up all kinds of flashing lights showing the results of the past "20+ spins" – as people don"t see them as independent events (it"s comical)
Short-term traders think in a very similar fashion (e.g., it has to "bounce" or "break-out" etc – it"s the same "ten heads" in a row philosophy)
In this case, they examine the recent price action over a few hours, days or weeks and think "it"s very likely" to behave a certain way.
Nope.
Yesterday"s or last week"s price action is an independent event.
What charts don"t tell is:
- Whether the trend will continue or reverse; or more importantly
- If the market is priced at reasonable value.
It won"t tell you if tomorrow, next week or next month"s coin flip will be a "head or a tail".
All it will do is quote you a price (pending its mood).
And determining value can only come from sound fundamental analysis – not from the tape.
Something for you to think about next time you "think" a stock might rally (or fade)
With that, let"s take a look at where monthly sentiment is and if it could be changing.
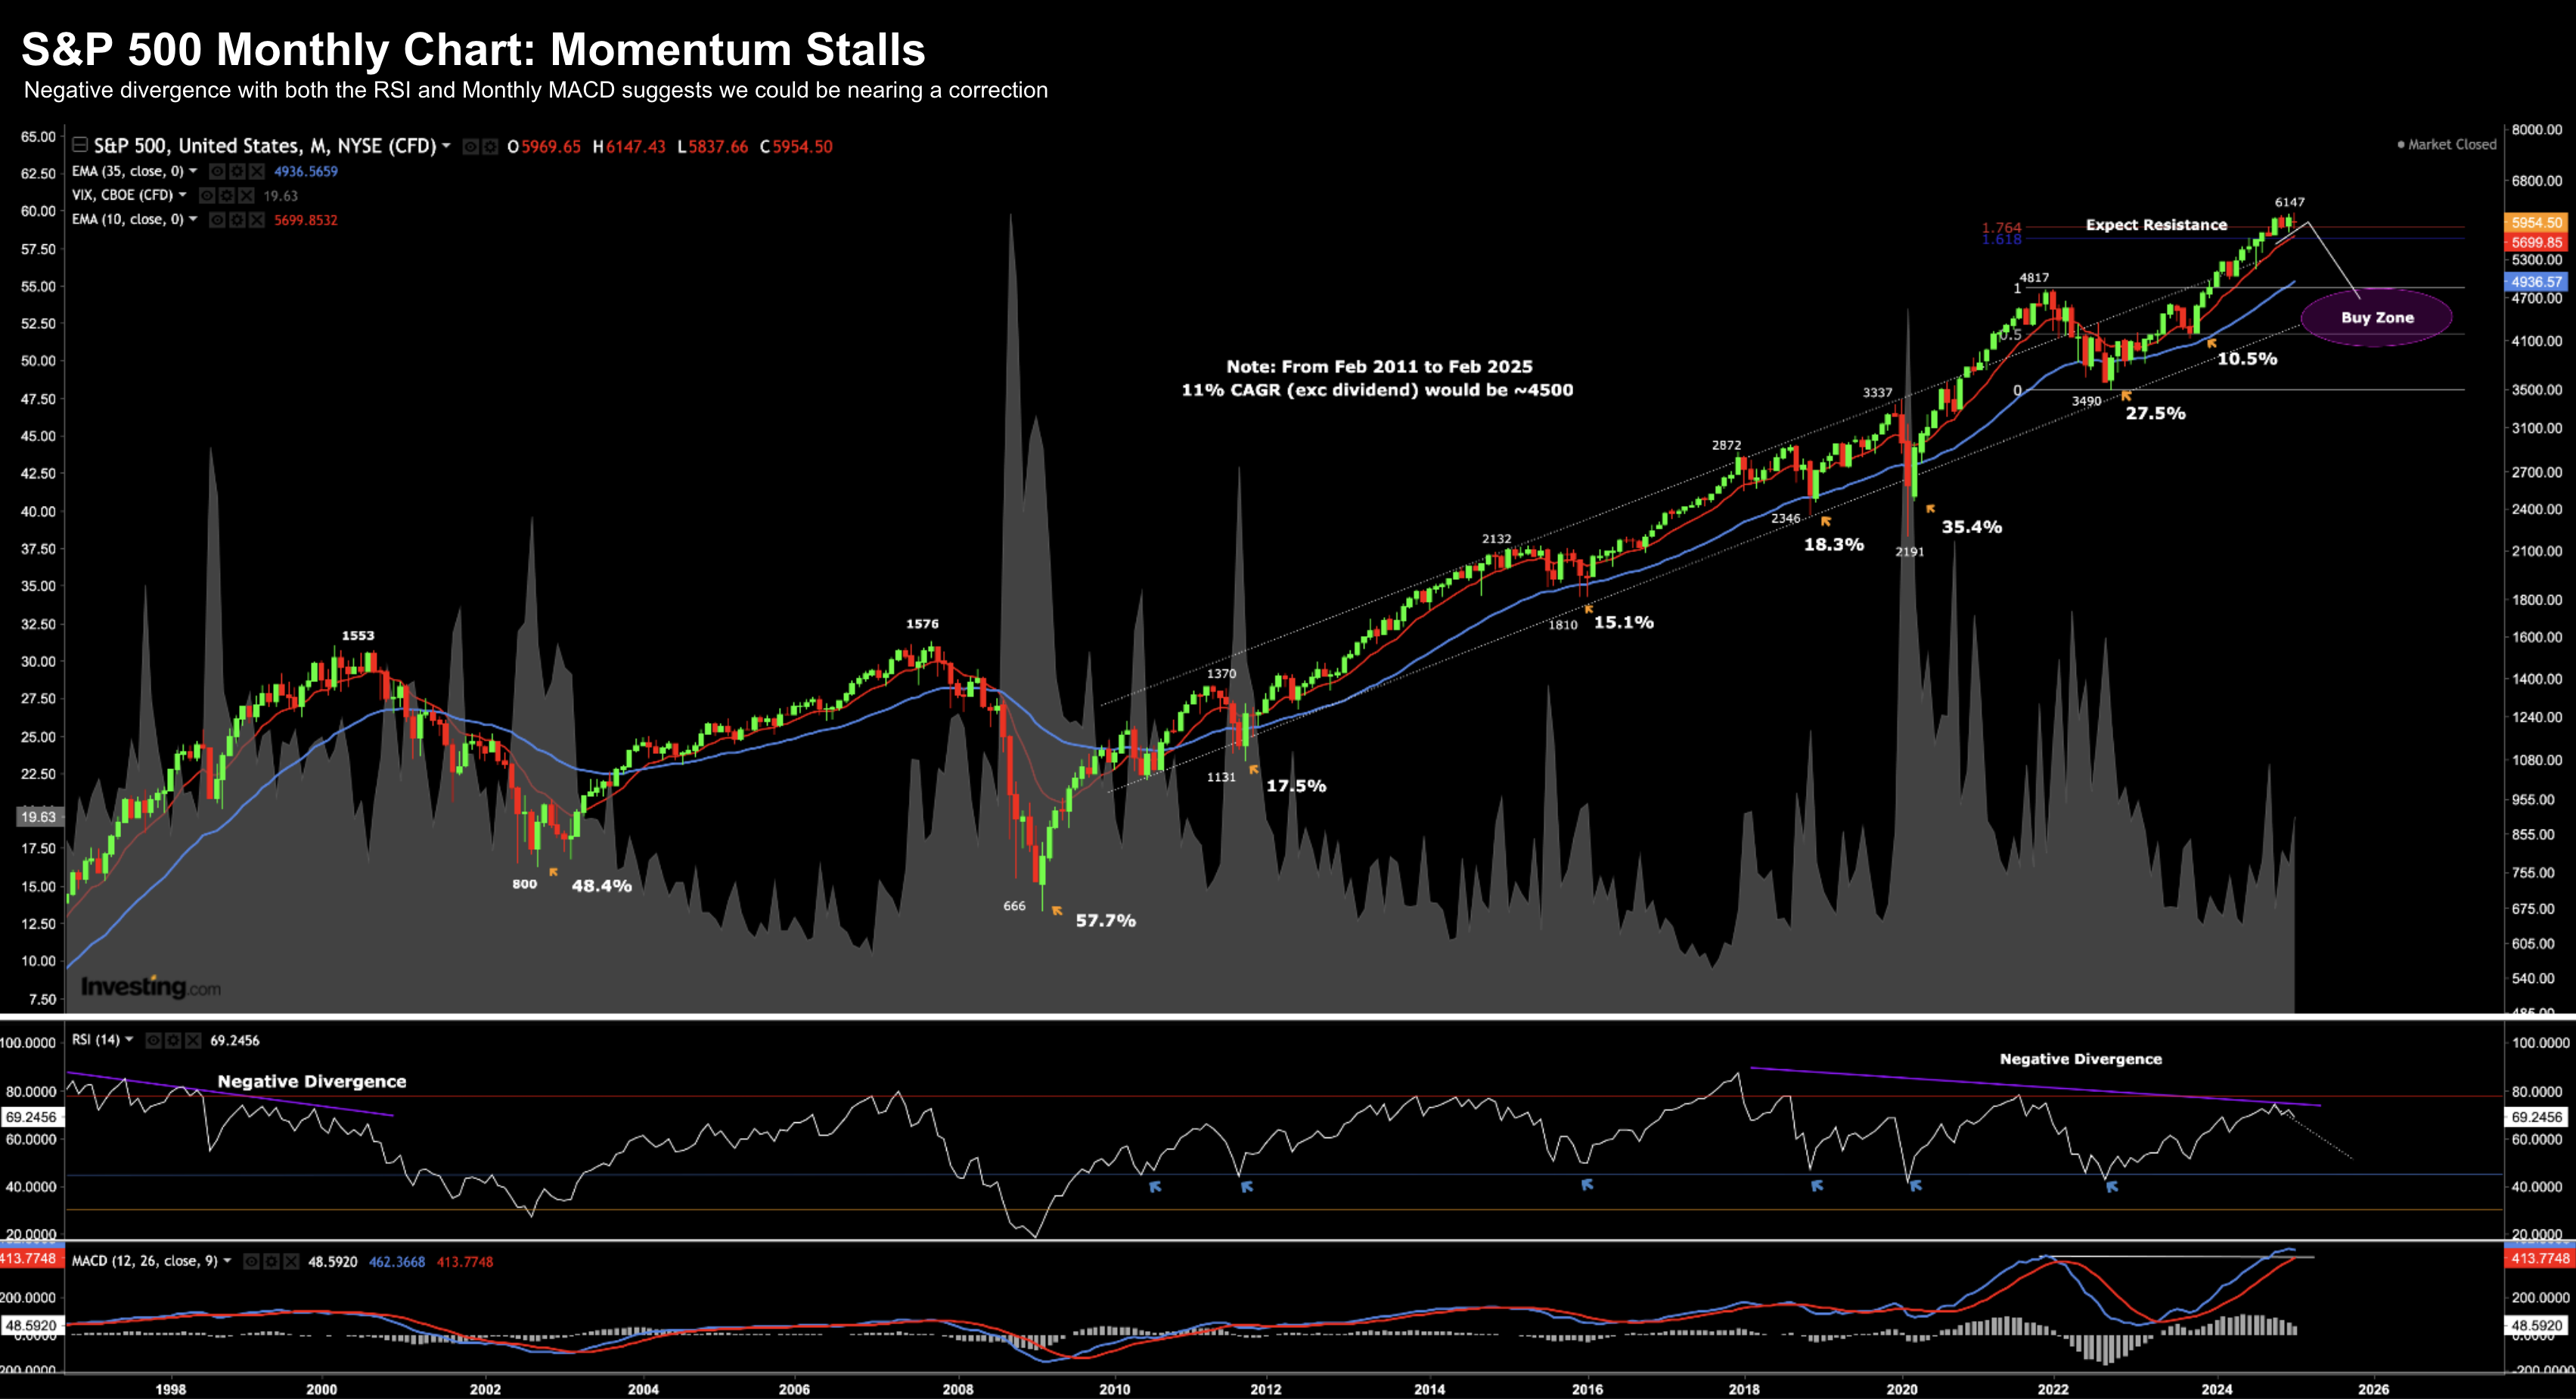
S&P 500 Monthly Chart
As a preface – the monthly chart helps us visualize one of the most incredible (bull) runs of the past 100 years.
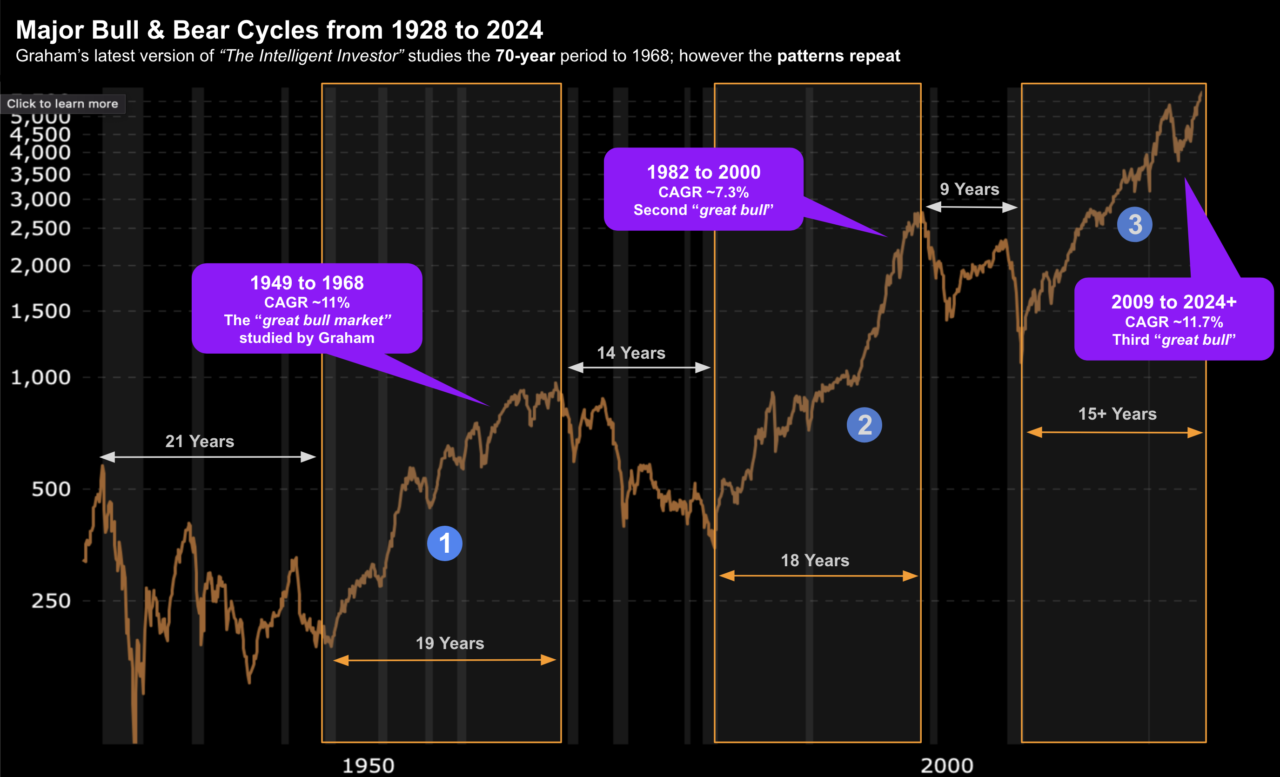
For example, I shared this chart as part of my 20-part series on "The Intelligent Investor"):

The Compound Annual Growth Rate (CAGR) for the Index from 2009 to 2025 is ~11.7%
As an aside, I wrote a useful CAGR calculator here (handy if you need to perform a quick calc!)
By comparison, the bull run of 1949 to 1968 saw a CAGR of ~11%.
And the run from 1982 to 2000 experienced growth of around 7.3%
By any measure – we are in rarified air.
And hey – we might be in the same rarified air another year or two from now.
Now those who began their investing journeys post 2008 have only experienced a bull market.
Think about that…
There are 40 to 45-year old fund managers who may have never traded through a deep recession (as they were ~23 in 2008)
I"m lucky enough to have experienced two harrowing 50%+ corrections – 2000 and 2008 (chart below)
And they won"t be the last….
With that – let"s look at what we find with the monthly chart as at the end of February 2025.

March 2 2025
To exemplify the loss of momentum – the S&P 500 traded 5762 at the end of August last year. At the end of Feb – it closed 5954.
That"s a gain of ~3.5% over 6 months.
From mine, the bulls are finding it harder to justify multiples of around 22x
You might be able to if 10-year yields were 1%... but not when they are north of 4.0%
They"ve already priced in earnings of $275 this year – growth of ~12% to get us to the 22x figure.
But what makes $275 EPS so certain?
From mine, there are a host of (growing) risks which jeopardize aggressive earnings growth this year ("Ready for a Growth Scare?").
We have (certainly not limited to):
- Reduced fiscal spend from the government;
- Stubbornly high bond yields (e.g., around 4.50% on the 10-year);
- Risk of higher inflation due to potential tariffs;
- A weary consumer – where discretionary spend is falling; and
- Various growing geopolitical risks
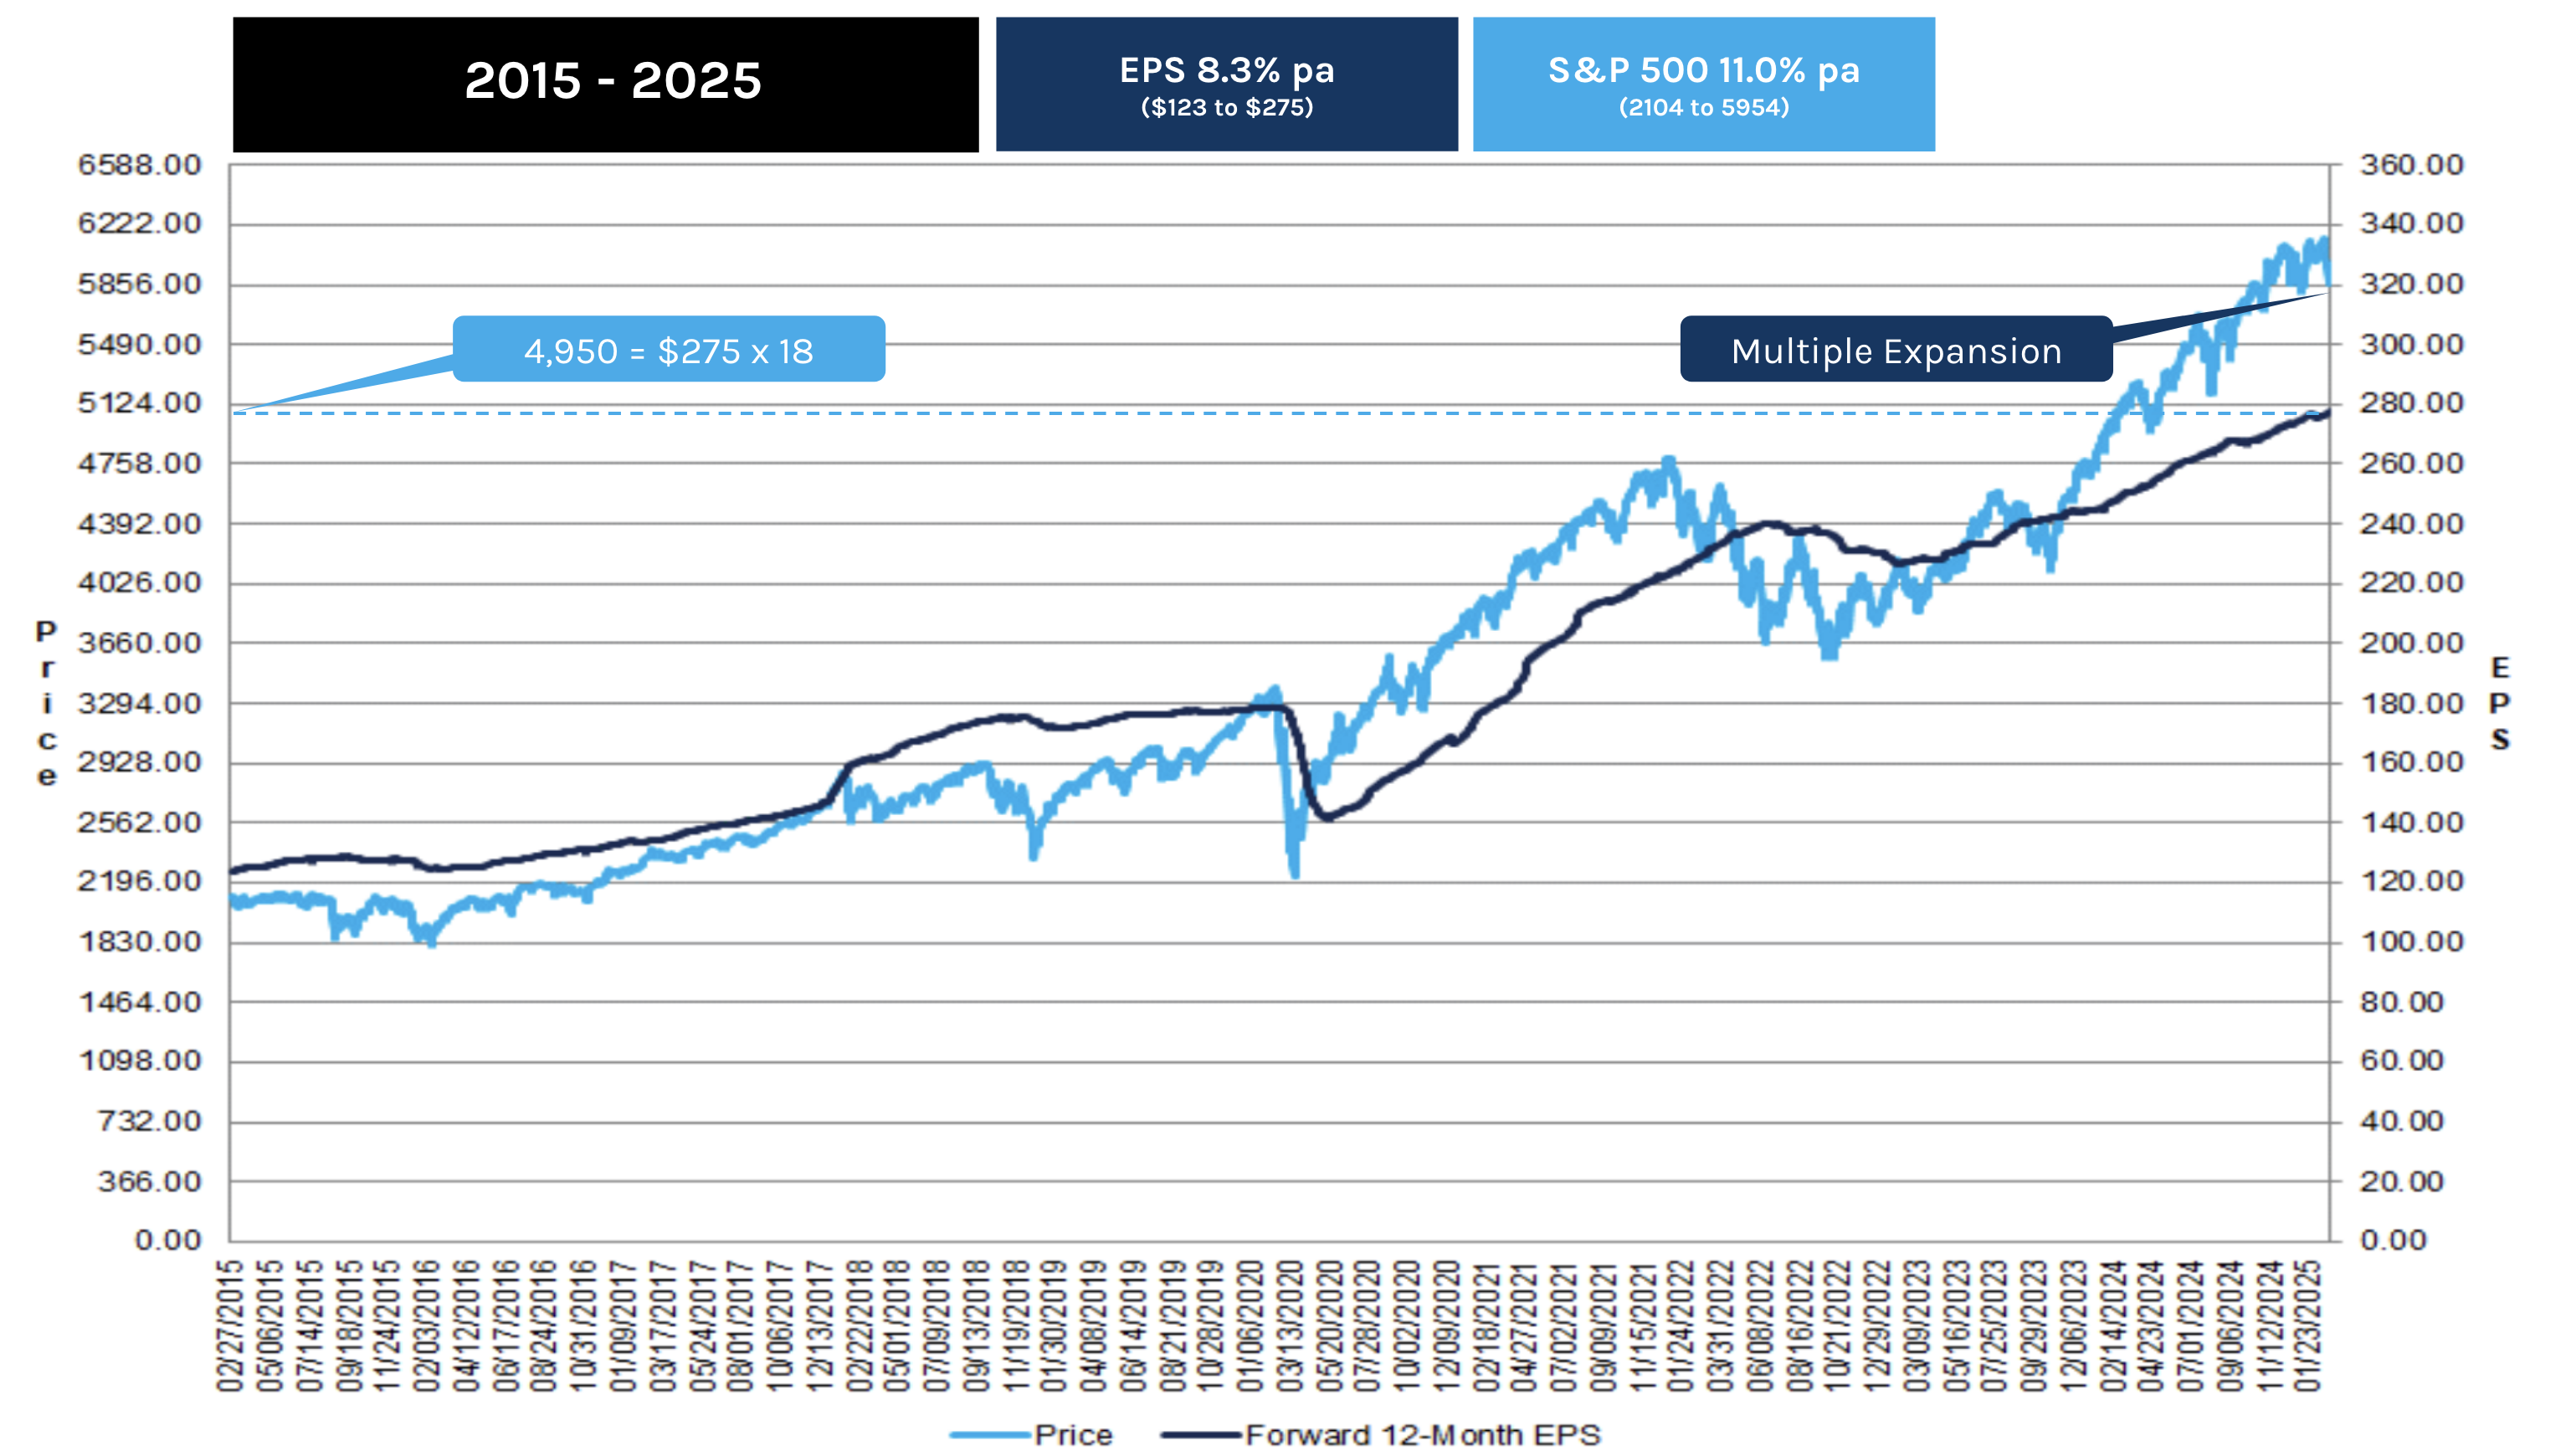
To better demonstrate the relationship between earnings and the share price appreciation – I've annotated a useful chart from Factset:

Earning per share growth has averaged 8.3% per annum from 2015 through today.
However, capital appreciation in stocks (i.e., exclusive of dividends) has seen a CAGR of 11.0% over the same 10-year period (check it here).
However, I draw your attention to the widening divergence over the past two years.
It"s as high as it"s been since the crash of 2008 (not shown on this chart)
Two things here:
- This helps explains the lack of momentum in stock prices the past 6 months; and second
- Investors should be prepared for mean reversion.
With respect to the latter – the average multiple paid over the past ten years has been around 18x EPS (which is historically high).
For example, over the past 100 years, that multiple is closer to 15.5x
$275 x 18 equals 4,950
That"s 17% lower than today"s asking price.
Very few people are even conceiving the possibility of the S&P 500 trading near 5,000.
As an aside, we will check in with these (very optimistic) forecasts at the end of year:
| Institution | 2025 | EPS | Fwd P/E |
|---|---|---|---|
| Oppenheimer | 7100 | 275 | 25.8 |
| Wells Fargo | 7007 | 274 | 25.6 |
| Deutsche Bank | 7000 | 282 | 24.8 |
| Soc. Gen | 6750 | 272 | 24.8 |
| BMO | 6700 | 275 | 24.4 |
| HSBC | 6700 | 268 | 25.0 |
| Bank of America | 6666 | 275 | 24.2 |
| ScotiaBank | 6650 | 255 | 26.1 |
| Barclays | 6600 | 271 | 24.4 |
| Evercore ISI | 6600 | 257 | 25.7 |
| Fundstrat | 6600 | 275 | 24.0 |
| Ned Davis Research | 6600 | 254 | 25.9 |
| RBC Capital Markets | 6600 | 271 | 24.3 |
| Citigroup | 6500 | 270 | 24.1 |
| Goldman Sachs | 6500 | 268 | 24.3 |
| JP Morgan | 6500 | 270 | 24.1 |
| Morgan Stanley | 6500 | 271 | 23.9 |
| UBS | 6400 | 257 | 24.9 |
| BNP Paribas | 6300 | 270 | 23.3 |
| Cantor Fitzgerald | 6000 | 267 | 22.5 |
| AVERAGE | 6617 | 268.0 | 24.6 |
The most bearish target was 6,000… let"s see how they do.
Putting it All Together
The monthly chart shows the momentum has slowed the past few months.
With stocks appreciating only 3.5% over the past 6 months – we see respective declines in the monthly RSI and MACD.
Neither of these indicators support the higher highs.
However, trading against momentum can often be a losing bet for a long period.
That said, at the end of the day, prices always come back to their fundamentals.
It"s when (not if).
The long-term chart shows the clear relationship between earnings and price appreciation over time.
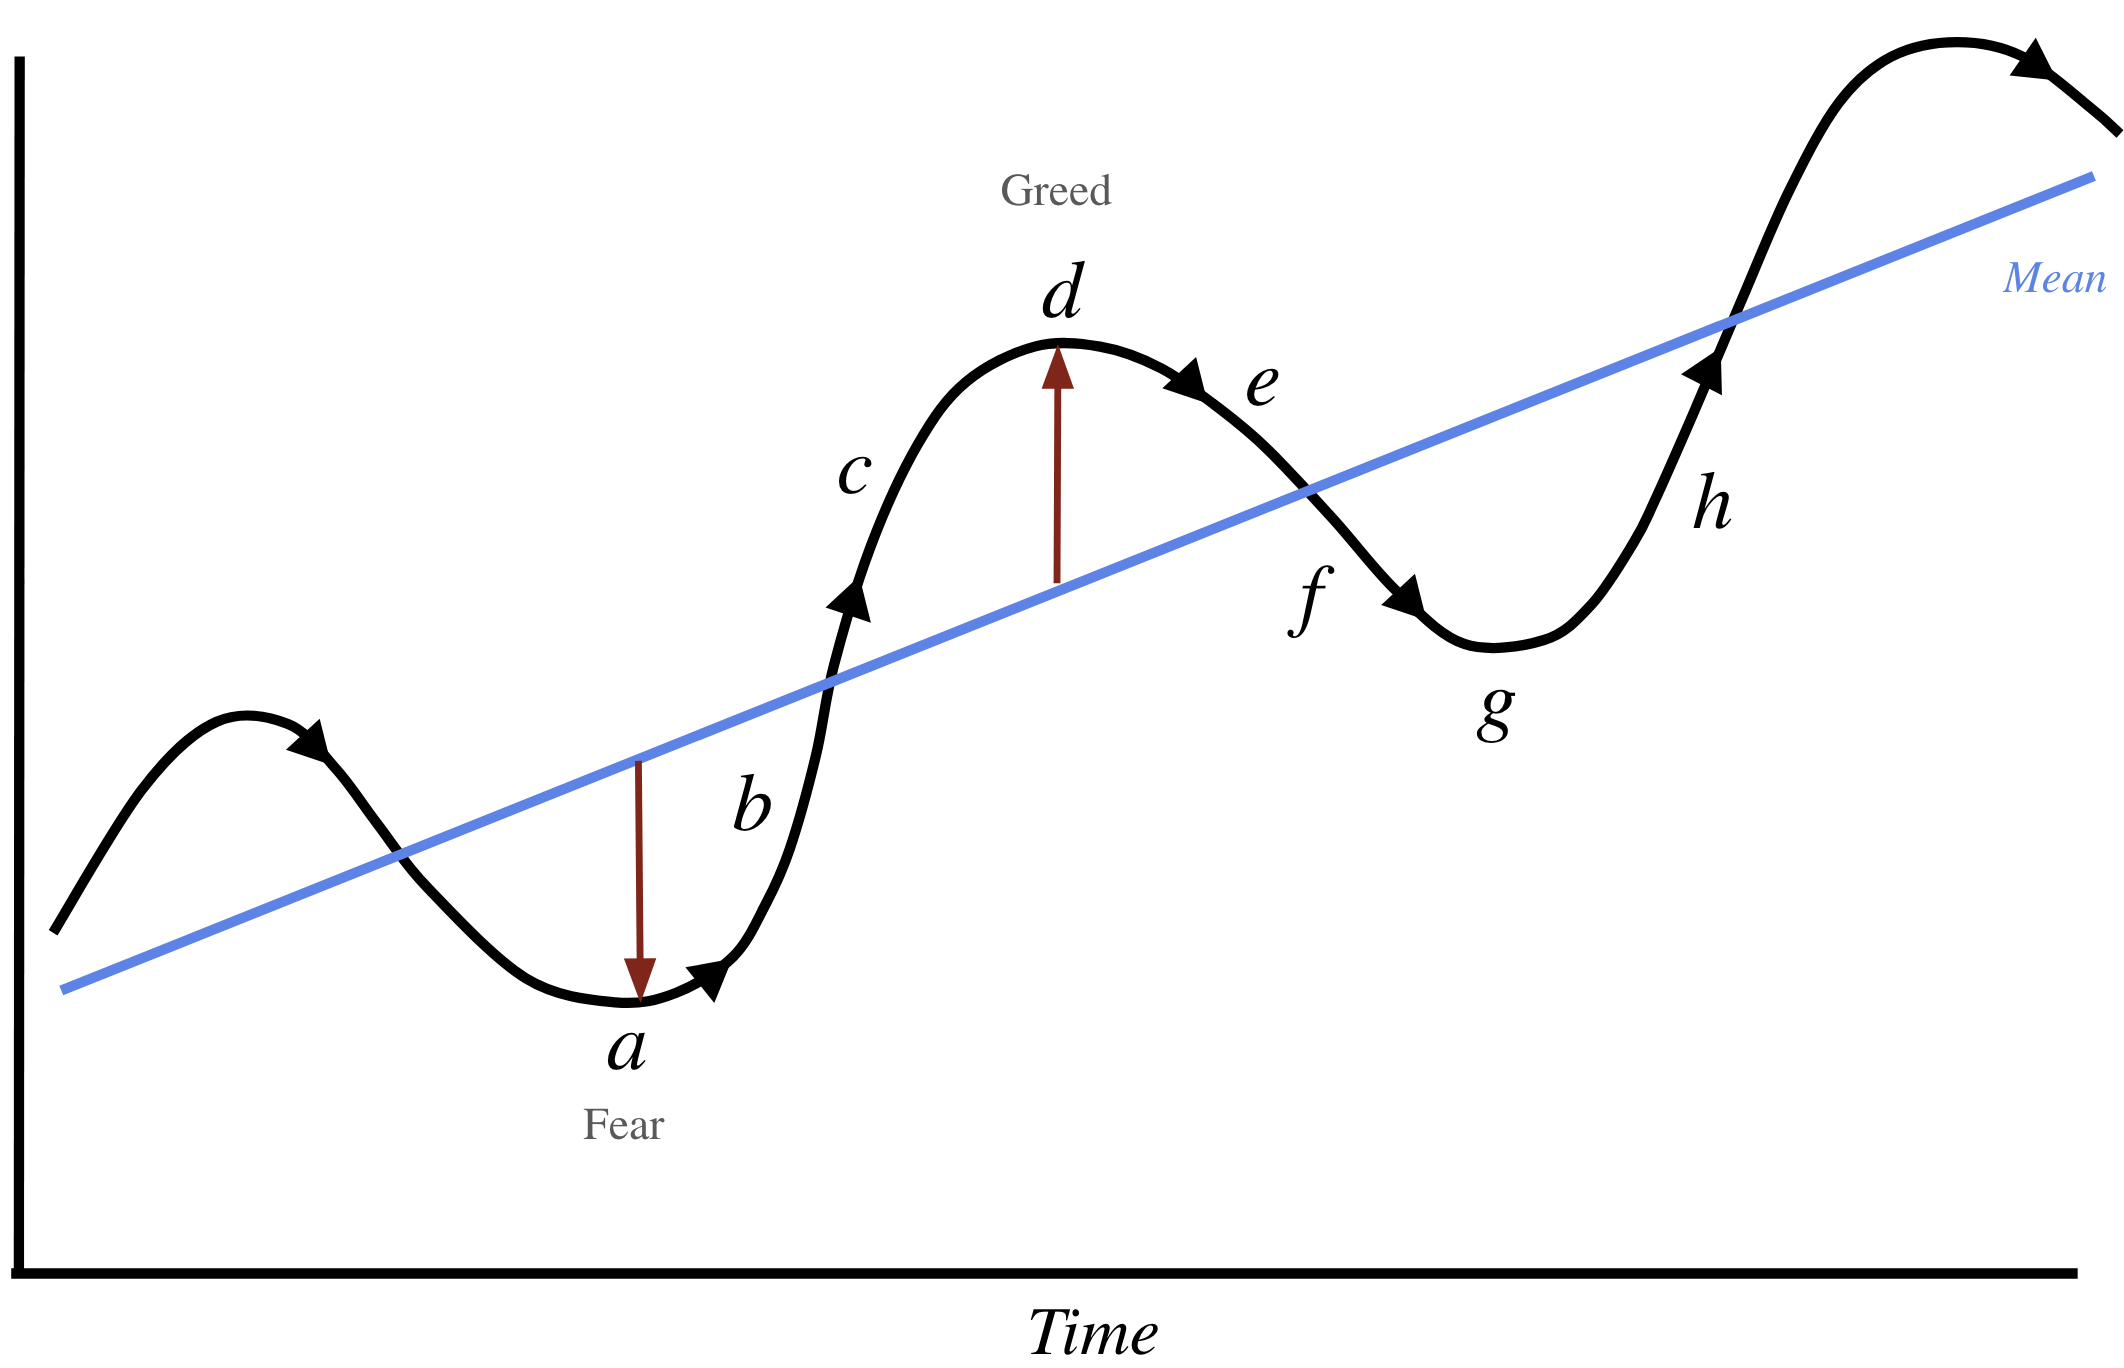
However, the price will always fluctuate above and below the long-term earnings average pending sentiment (e.g., greed, fear, bias etc)
And those fluctuations can last months (sometimes years)
It"s investors job to remain acutely aware of where we are on that continuum and to manage their risk (per this post)

For example, consider the blue line the growth in average earnings (typically around 6-7% pa).
Over decades, they show a gradual upward sloping line (partly due to inflation at 3%) – but it"s rarely a straight line.
The black line is the price action – exaggerated by self-defeating behavior such as bias, fear and greed.
If I were to guess – at 22x forward earnings – we are closer to "c or d" – than we are "f or g".
The idea is to reduce exposure closer to "c to d" (see this post – "Buffett: Often Nothing Looks Compelling") and add exposure closer to "f to g"
Unfortunately, most investors do the opposite.
