The Carry Trade Unwind: How Yen Strength and JGBs are Sinking Tech Stocks
Words: 1,134 Time: 6 Minutes
- Japanese Government Bonds roar higher on inflation.
- A close correlation between MSFT and the "carry trade".
- How I hedged coming into the year…
Enjoying the ride so far?
I guess it depends on how you were positioned. Even a genius can look like an idiot if they are caught out of position.
Those who had excessive exposure to tech (or chips) may not be enjoying things. Most of their 2024 gains have been wiped out. It doesn"t take long when there"s a rush to the exits.
On the other hand, if you pivoted into value-orientated names (which traded at more reasonable multiples), things will look more positive.
How I Hedged
As we started this year, I made the comment it felt a lot like the end of 2021.
That year, I warned of excessive valuations in tech and took cover. I was slightly early, but it meant my portfolio traded flat in 2022—which was around 19% better than the Index. What"s more, I was able to add back exposure at more reasonable levels, which set me up for a great 2023.
During the second half of last year, I also took profits on large-cap tech names. And very late last year, I completely exited my position in Apple. Valuations had simply gone too far for my liking.
But again, I was a little early taking profit (as I can"t predict tops or bottoms). I consider it like catching a train you cannot afford to miss.
Let"s say the train departs at 9:00am sharp and there are no other trains that day. Would you rather be there at (a) 8:50am; or (b) 9:05am?
Most of you would rather be early. This means you are willing to forgo a little more upside… but you were not late. If you"re still over-exposed to tech (e.g., more than 20-30% of your portfolio), you missed the train. You arrived at 9:05am and it left the station.
Now what?
Being caught out of position is a horrible place to be. And much of this game is about positioning. It"s not about "timing it just right" or trying to pick a top or bottom. That"s near impossible to do.
Let me share two performance charts. The first is my year-to-date performance (March 11) vs the S&P 500 (blue). I"m still in positive territory for the year, however the Index has lost ~5%.
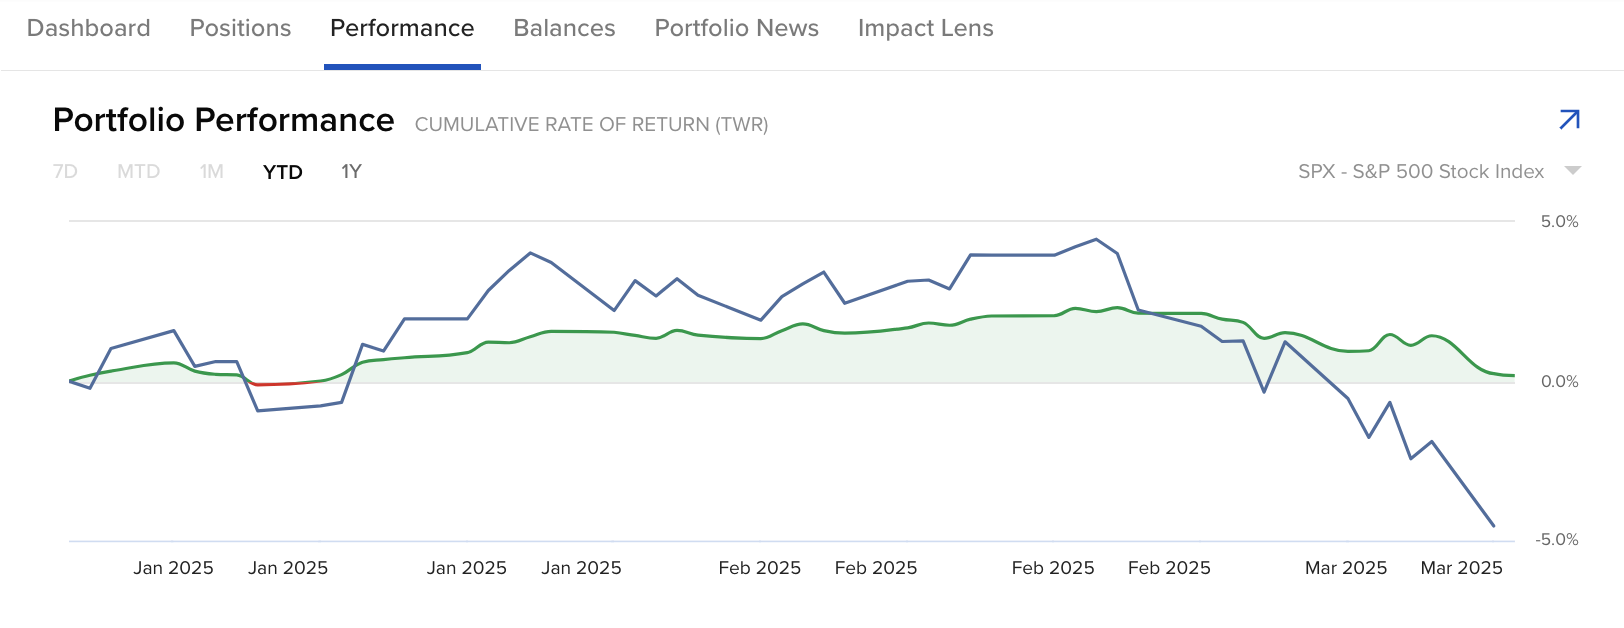
That said, I was not immune from the downside, as I maintain a 65% long exposure. I will always have some exposure to the long side (i.e., owning equities).
Many of those names are down perhaps 10% or more. However, they may only represent between 2% and 4% of my total portfolio. On the other hand, some positions are doing okay. Names like Kraft Heinz, Merck and Johnson & Johnson (which I mentioned several weeks ago).
But let"s extend to show the rolling 12 months year-over-year comparison. This shows where I was a little early taking profits as the market continued to march higher. This cautious move saw me trail the S&P 500 by ~10% at one point. But I considered it insurance against over-optimism.
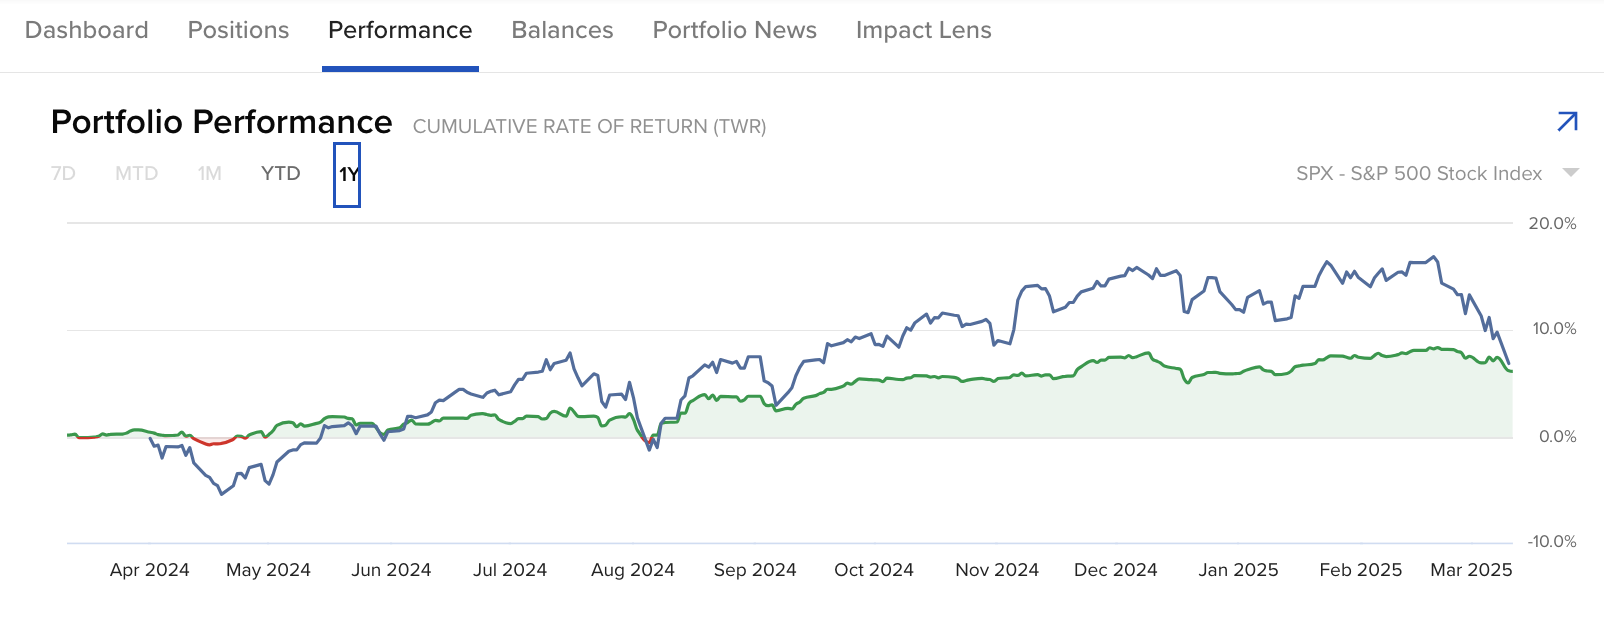
I was not tempted to chase over-priced and over-hyped names. If you wanted to pay 35x forward earnings for Microsoft—completely abandoning the discipline of seeking 15x-20x P/FCF for moated, non-cyclical assets—then have at it. You are a braver trader than I.
Things are now on level footing… where I"m well placed to pick up reasonably valued stocks. I would summarize my approach to markets as aiming for acceptable and sustainable returns over the long-term. But more than this, my focus is avoiding large (steep) losses.
I will always prioritize not losing capital vs chasing fast gains. It"s a disciplined approach based on:
- Capital allocation (avoiding excessive concentration in any one sector and/or position).
- Buying very high-quality stocks (targeting that 15%+ ROE & ROIC threshold) at reasonable valuations.
- Holding positions on average for 3-4 years (sometimes longer).
- Selling when valuations are simply too high (the most difficult task of portfolio management—see this post).
Don"t Forget About the "Carry Trade"
It"s fair to say the market is wrapped around the axle on all things tariffs. And that makes sense. However, it"s also a classic case of recency bias, where investors overweight the daily headlines and ignore the structural shifts underneath.
Personally, I think tariffs are just part of the story—arguably not the most impactful. For example, I consider both:
- Massive cuts to government spending (and its impact on GDP); and
- The damage to business and consumer confidence
… as greater risks to economic growth. We will get the Michigan Consumer Sentiment survey later this week (I"m more interested in this than CPI tomorrow).
Now tonight"s missive shares two charts we need to be very mindful of:
- Japanese Yen vs US Dollar; and
- Japanese Government Bond (JGB) Yields
For example, it was around July last year when the market panicked on the unwinding of the carry trade. Here"s a chart from Charles Schwab at the time… "is it over?"
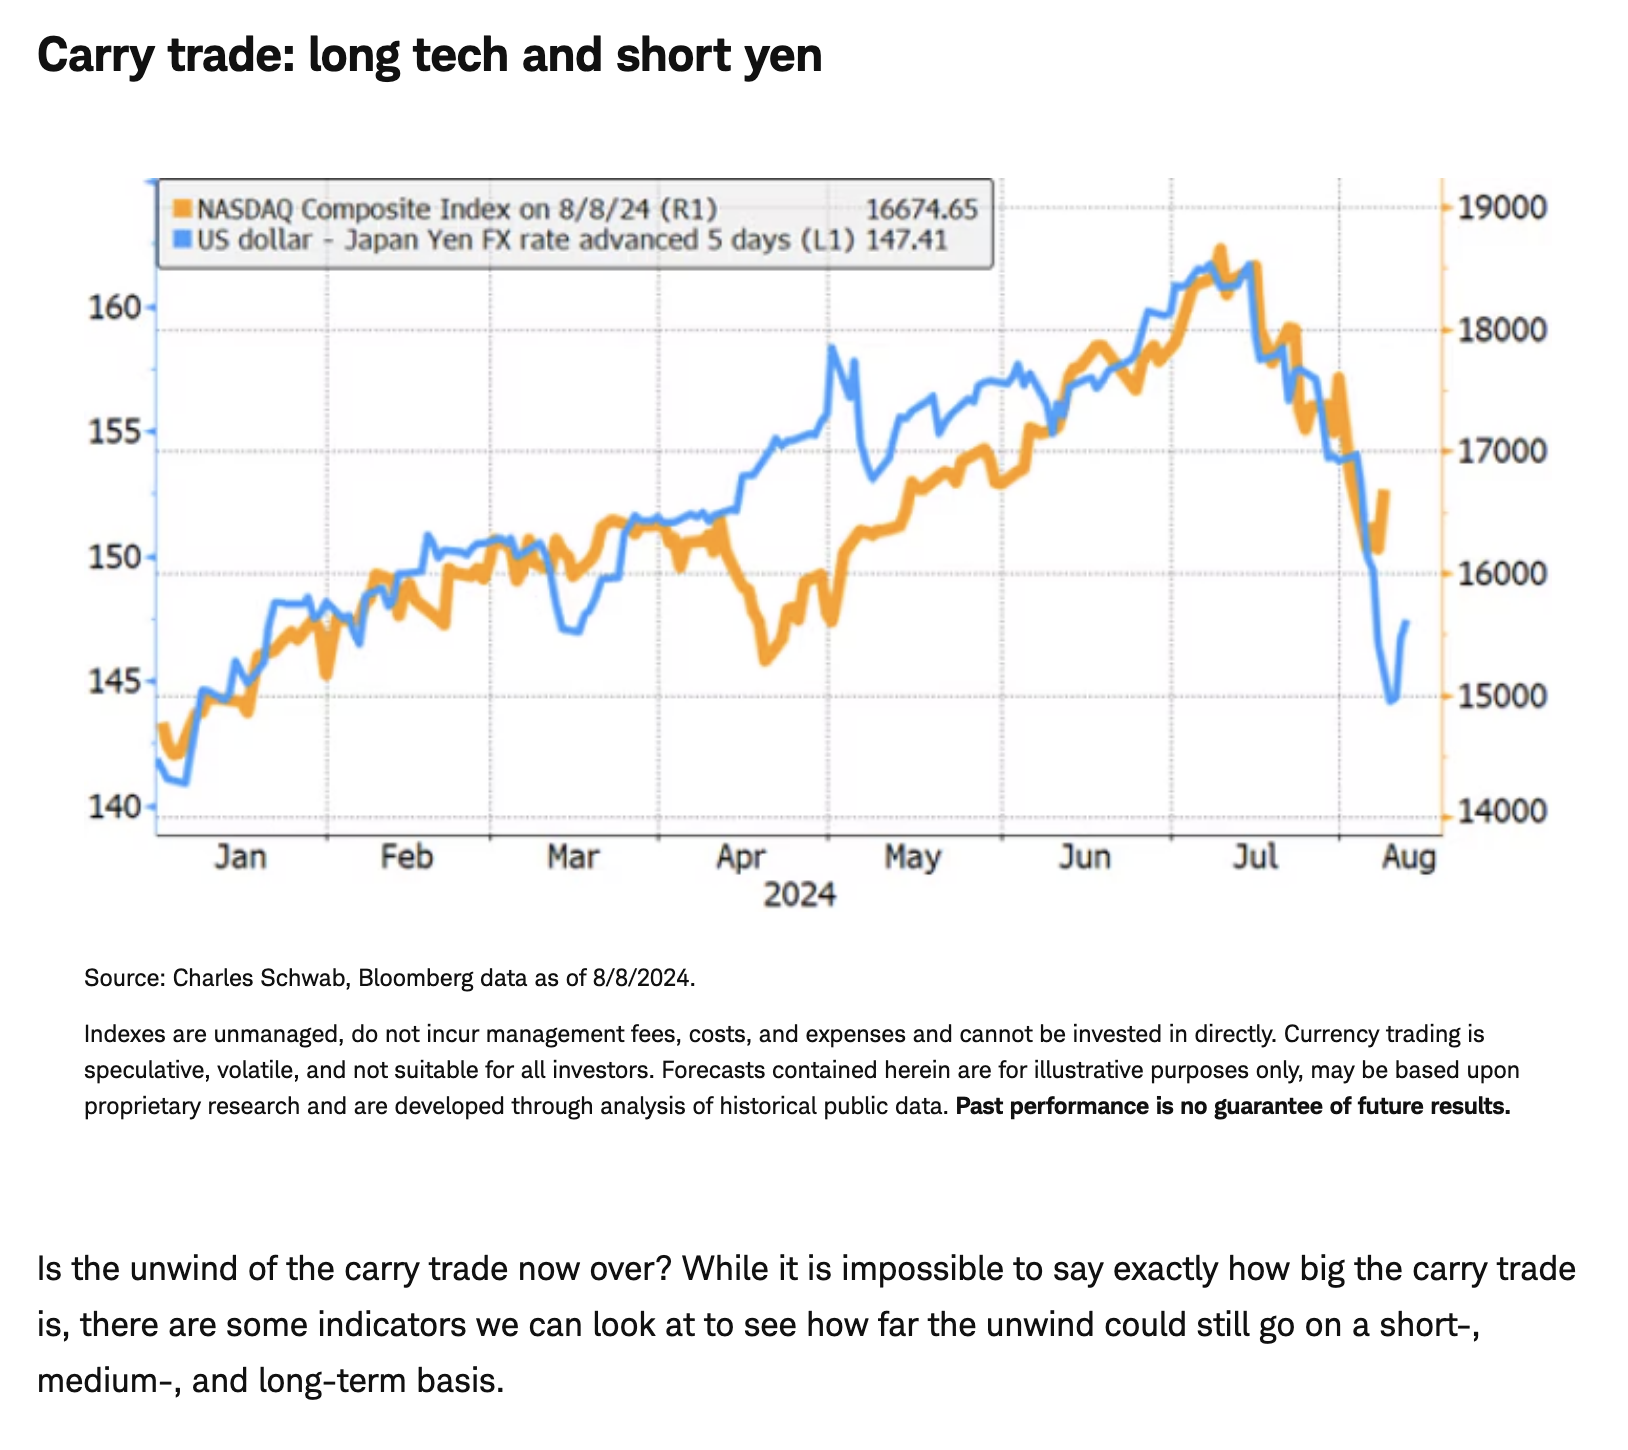
Markets were panicked as the VIX soared above 40 (which represented a great buying opportunity). Over the past few months, guess what: the Yen has been quietly strengthening again.
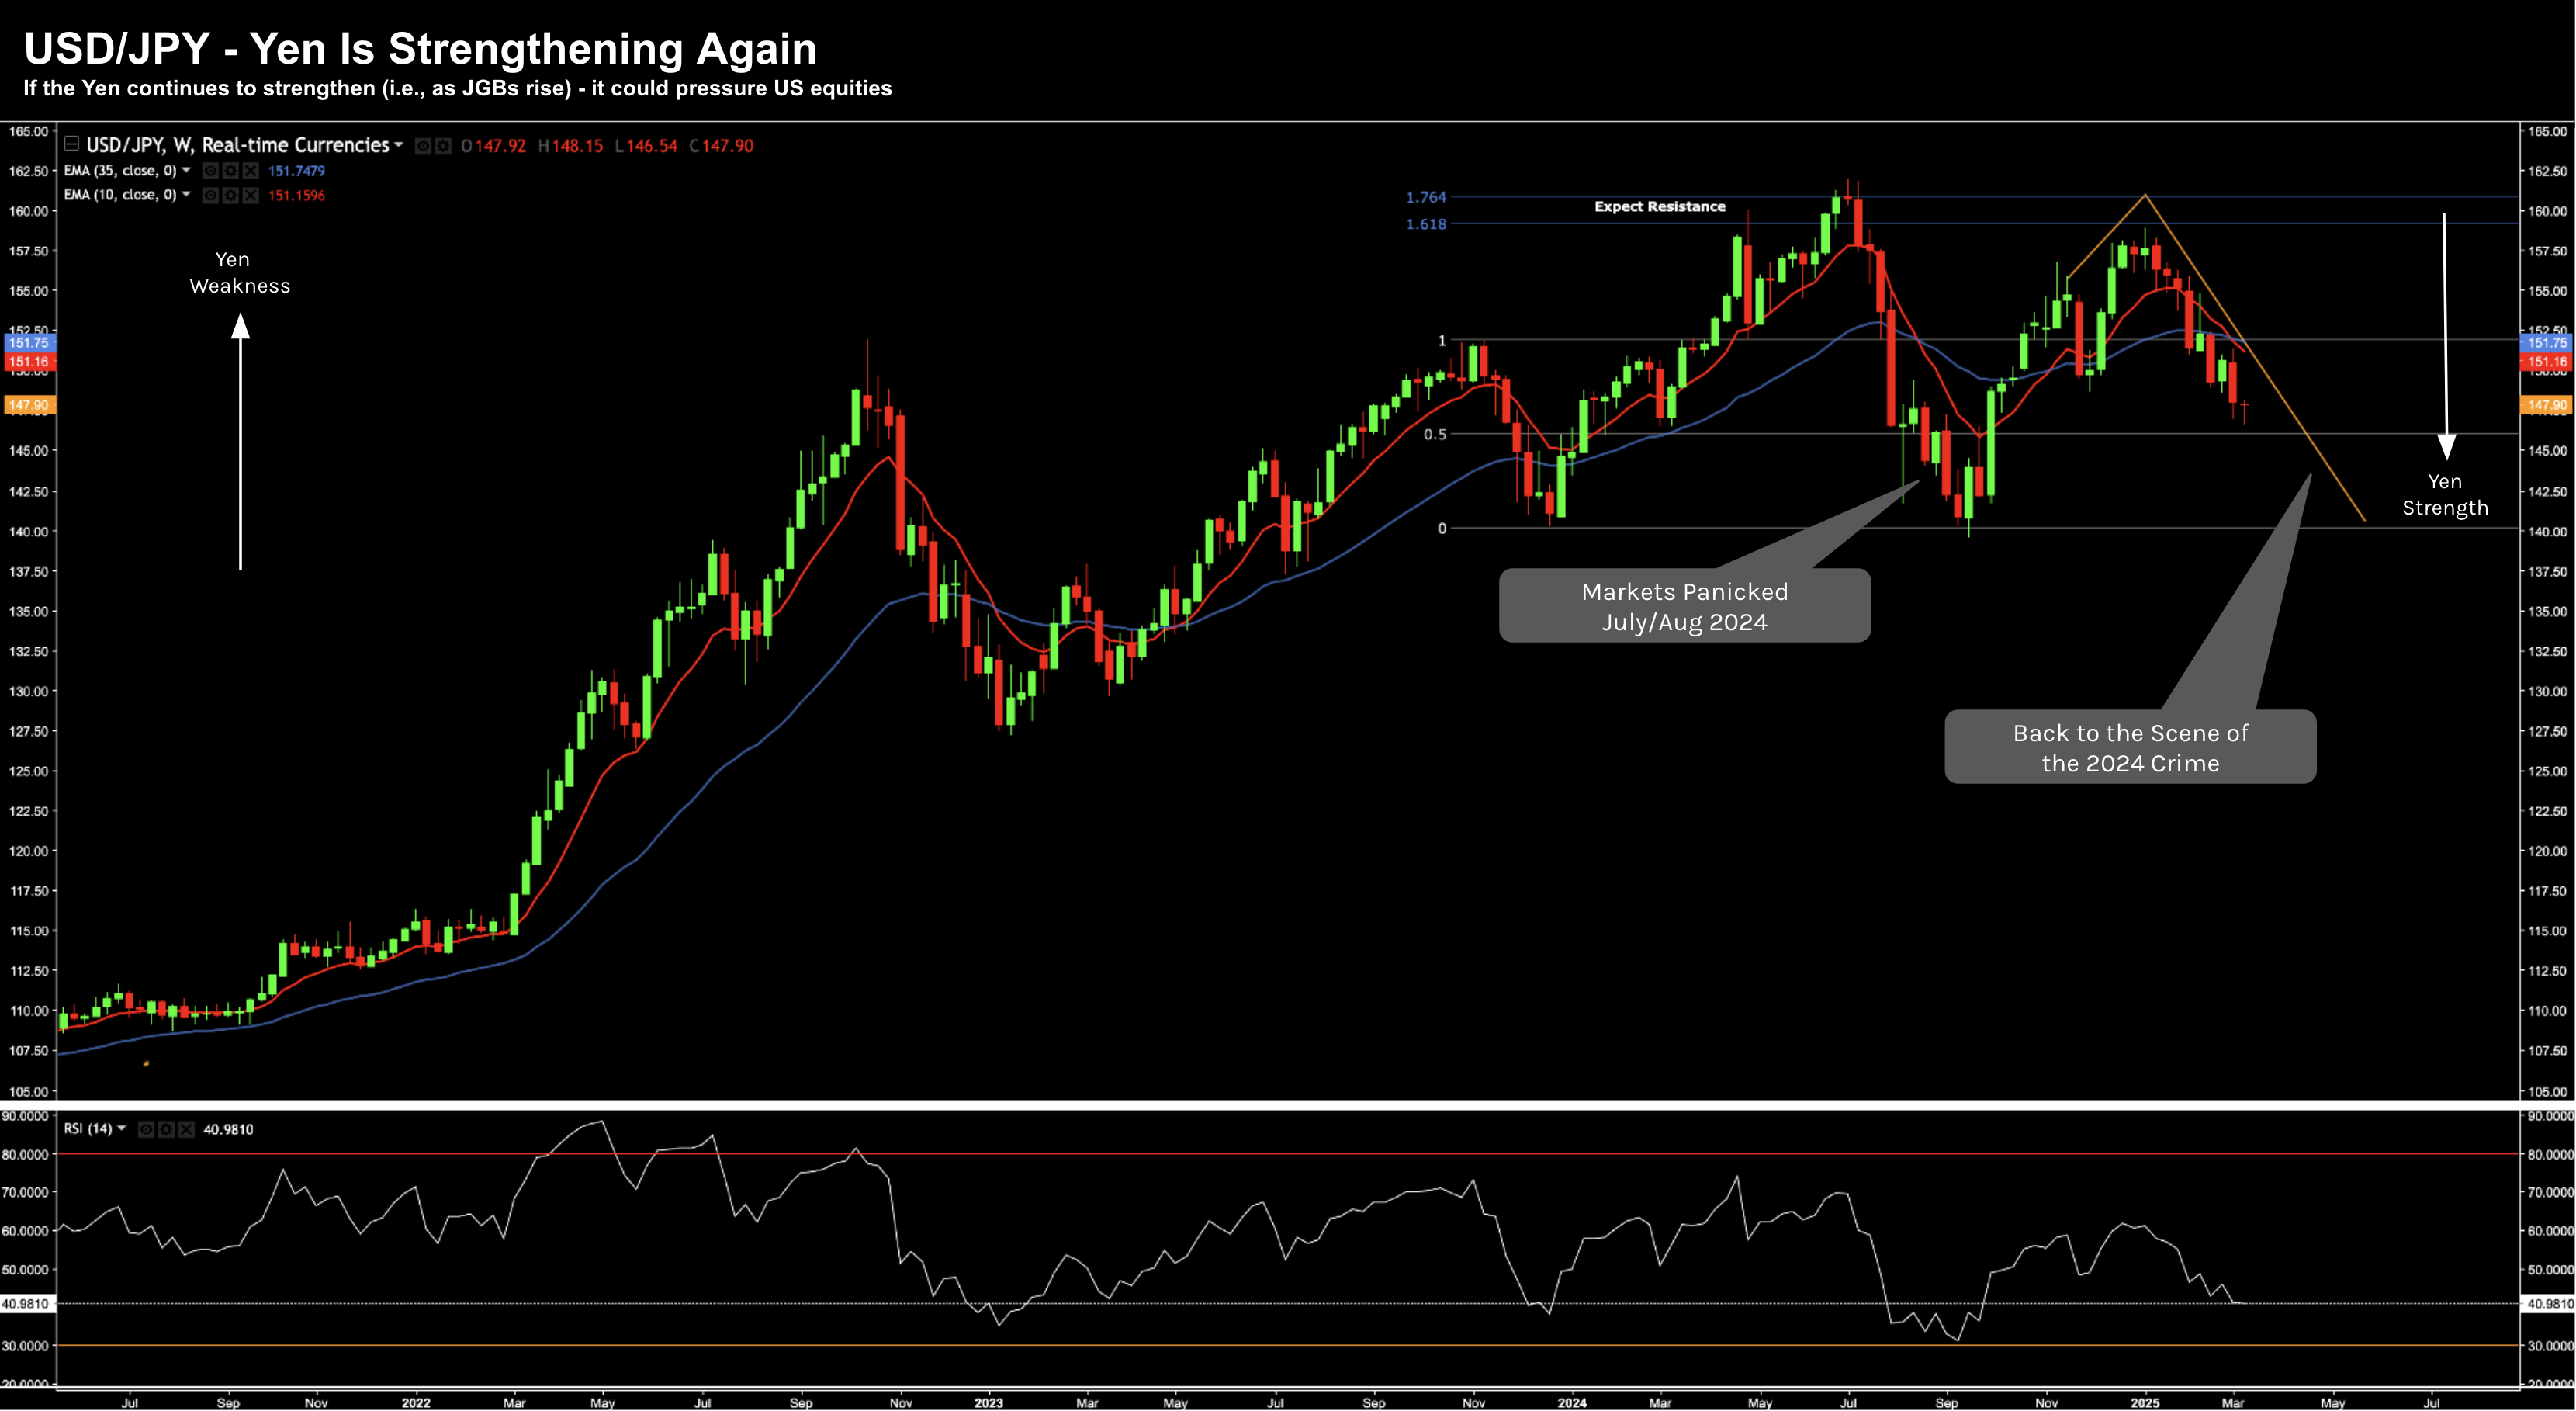
The Yen started weakening around mid-January. Therefore, it"s not a coincidence that the S&P 500 peaked the week of January 20th.
But here"s my chart of the day:
Below is the price action of Microsoft (MSFT) vs the movement in the USD/JPY.
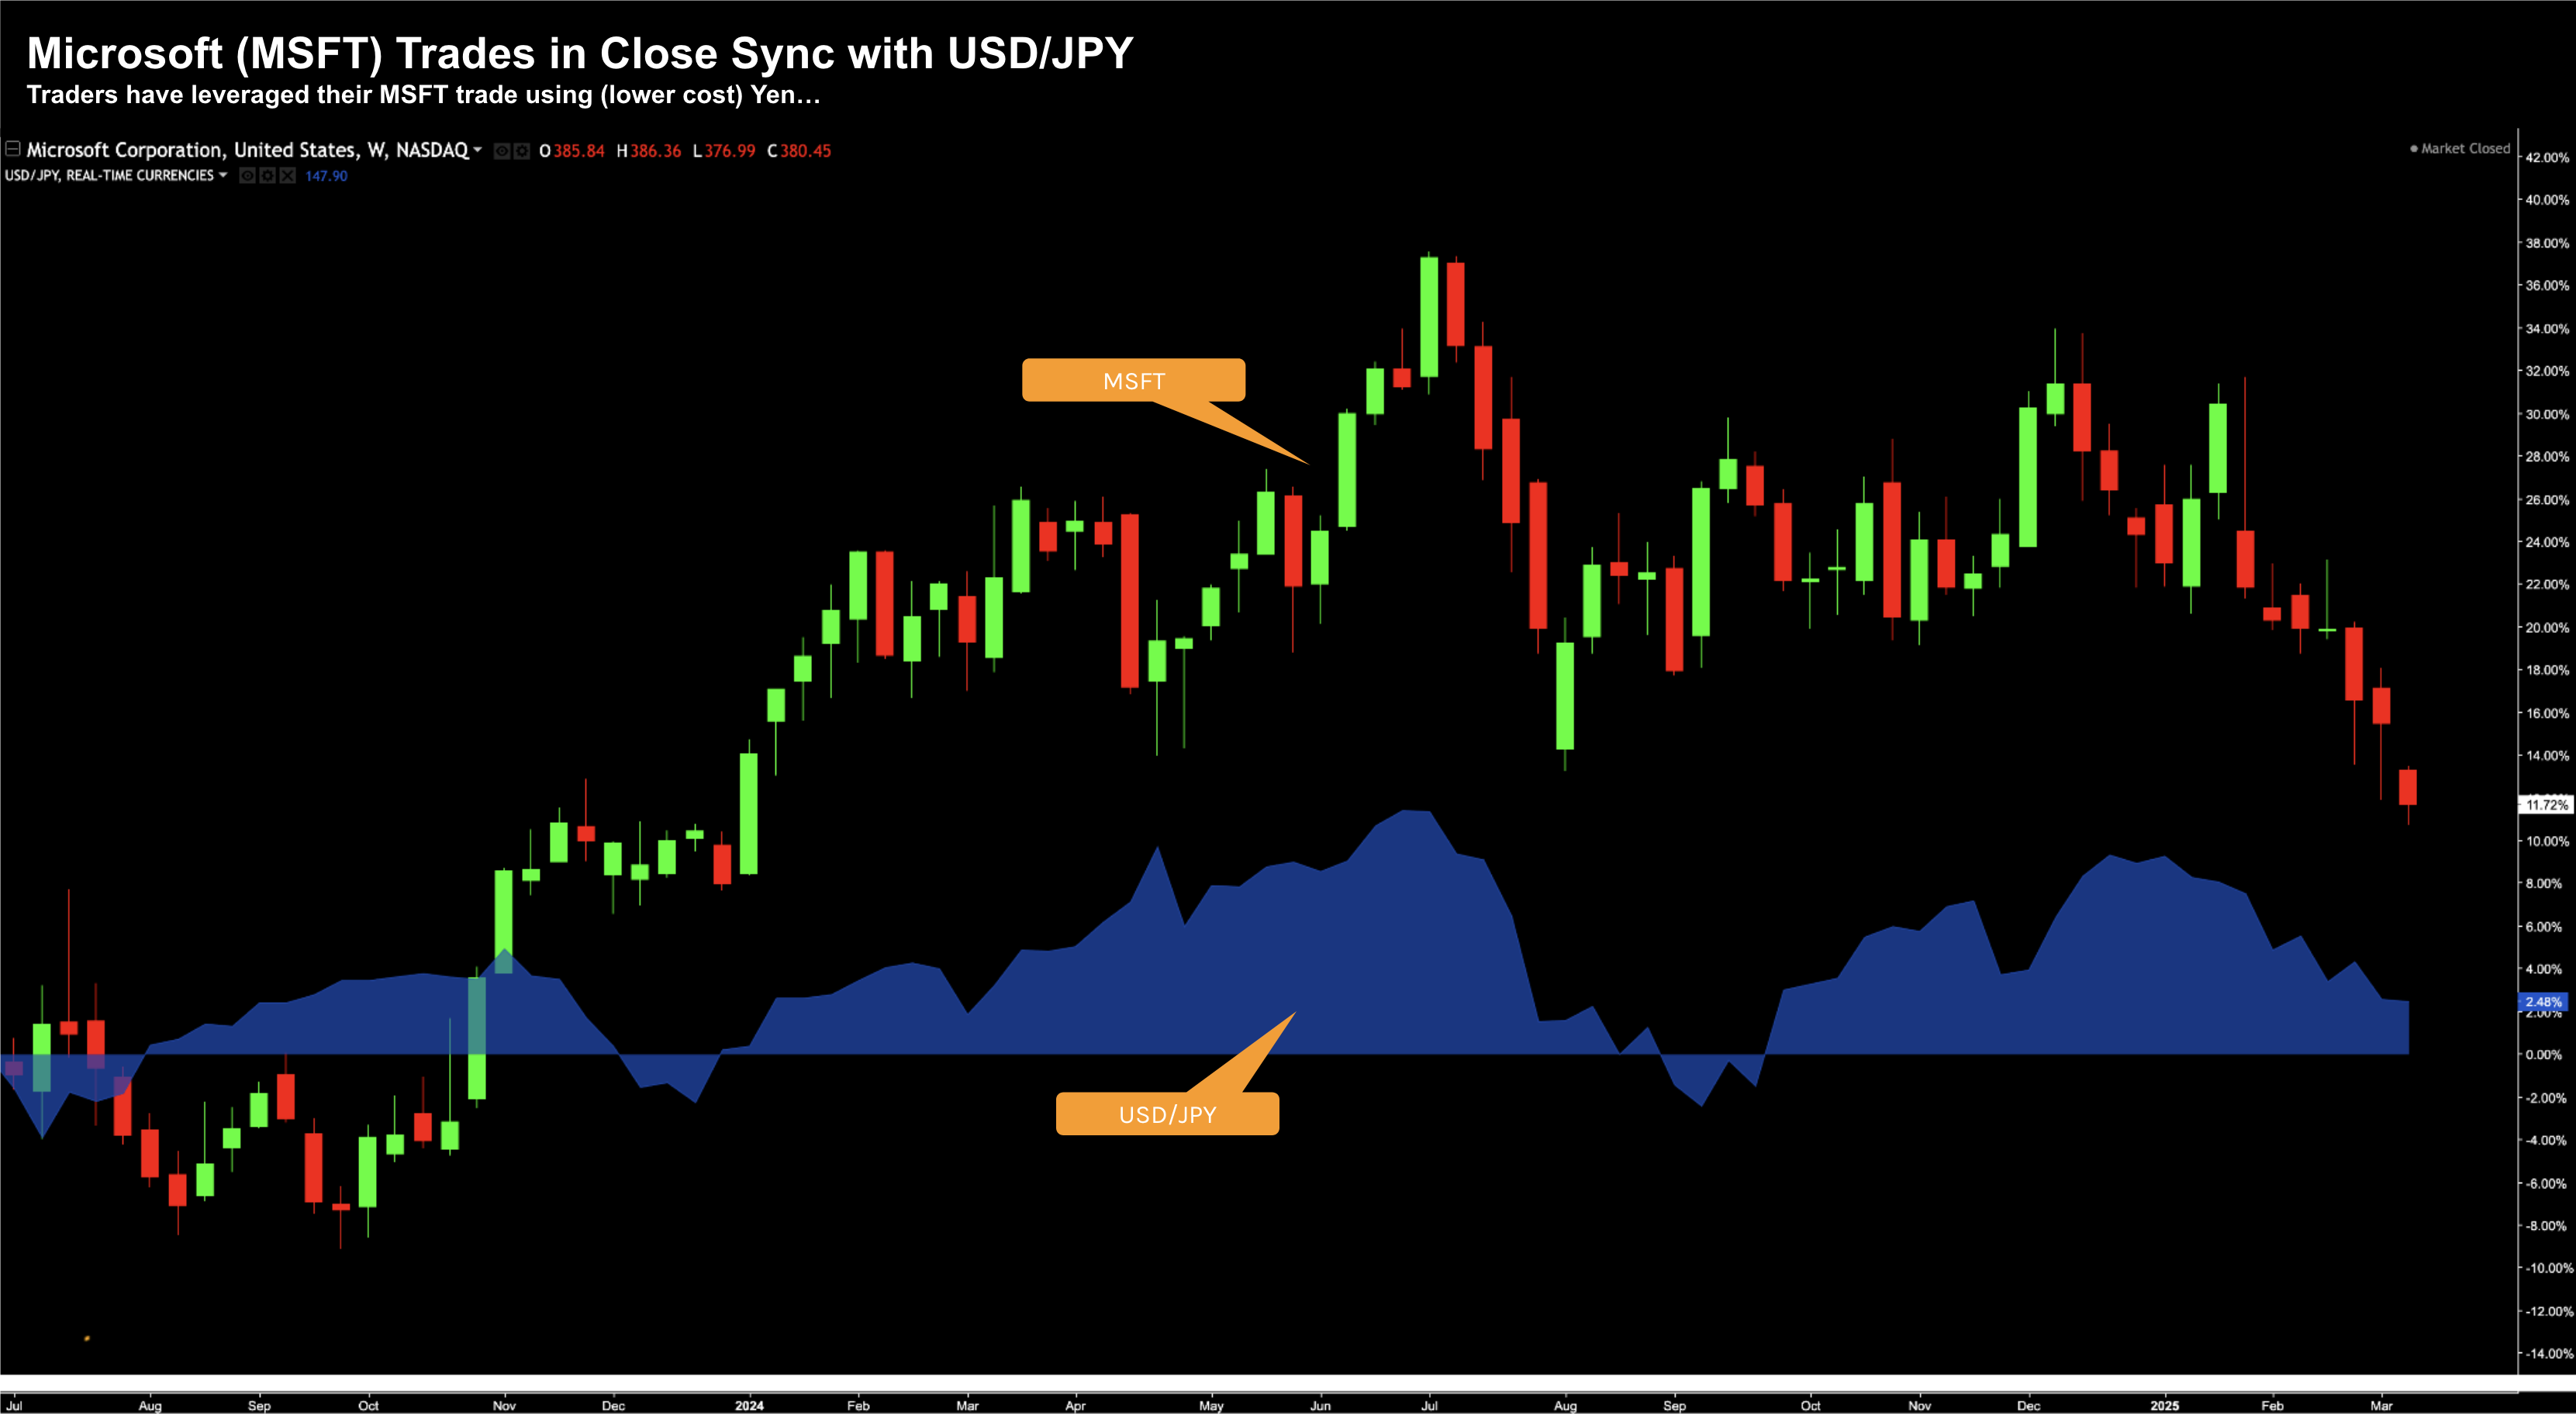
The correlation with Microsoft is striking. Where the yen goes… so goes Microsoft.
And from my perspective, much of the selling in large-cap tech is exactly what we see with the unwind of the yen.
Again, look back at the chart from Charles Schwab which compares the Nasdaq to the movement in the Yen. Investors borrow in yen and pile that money into high quality (supposedly high return) stocks like the Mag7.
However, the trade cuts both ways. Therefore, if you believe the Yen is likely to continue strengthening, then don"t expect large cap tech to rally.
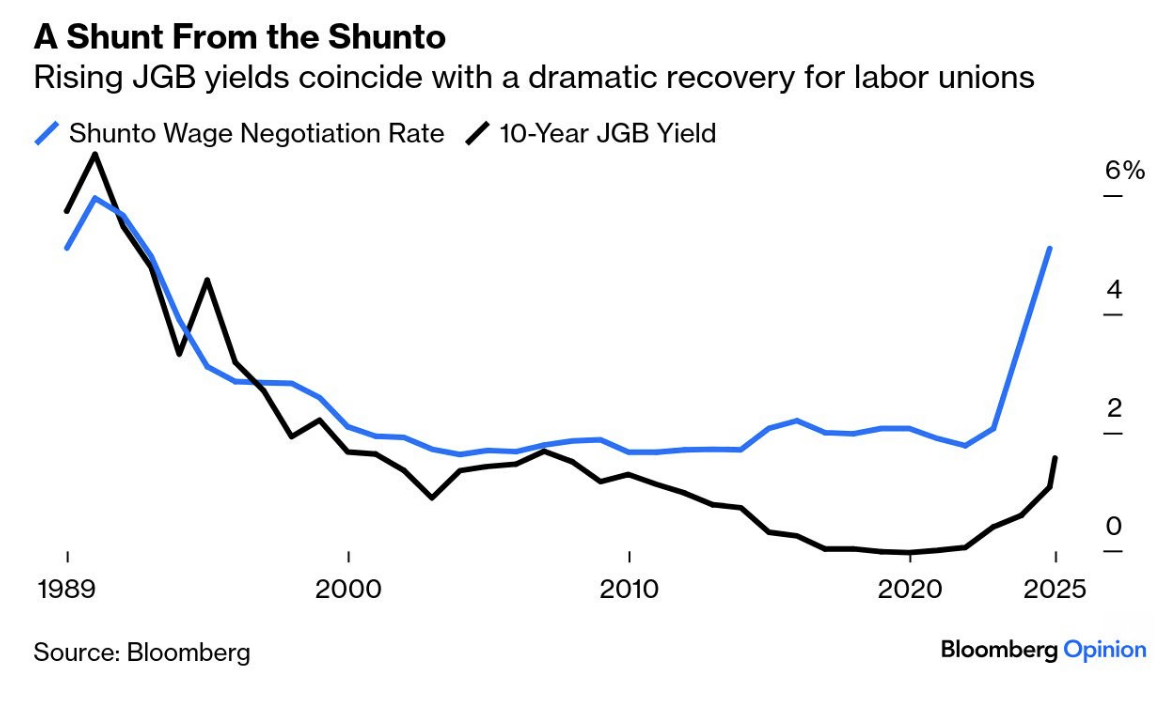
This is a good segue to taking a look at what we see with JGB yields. They"re soaring as inflation returns and Japanese wages rise:
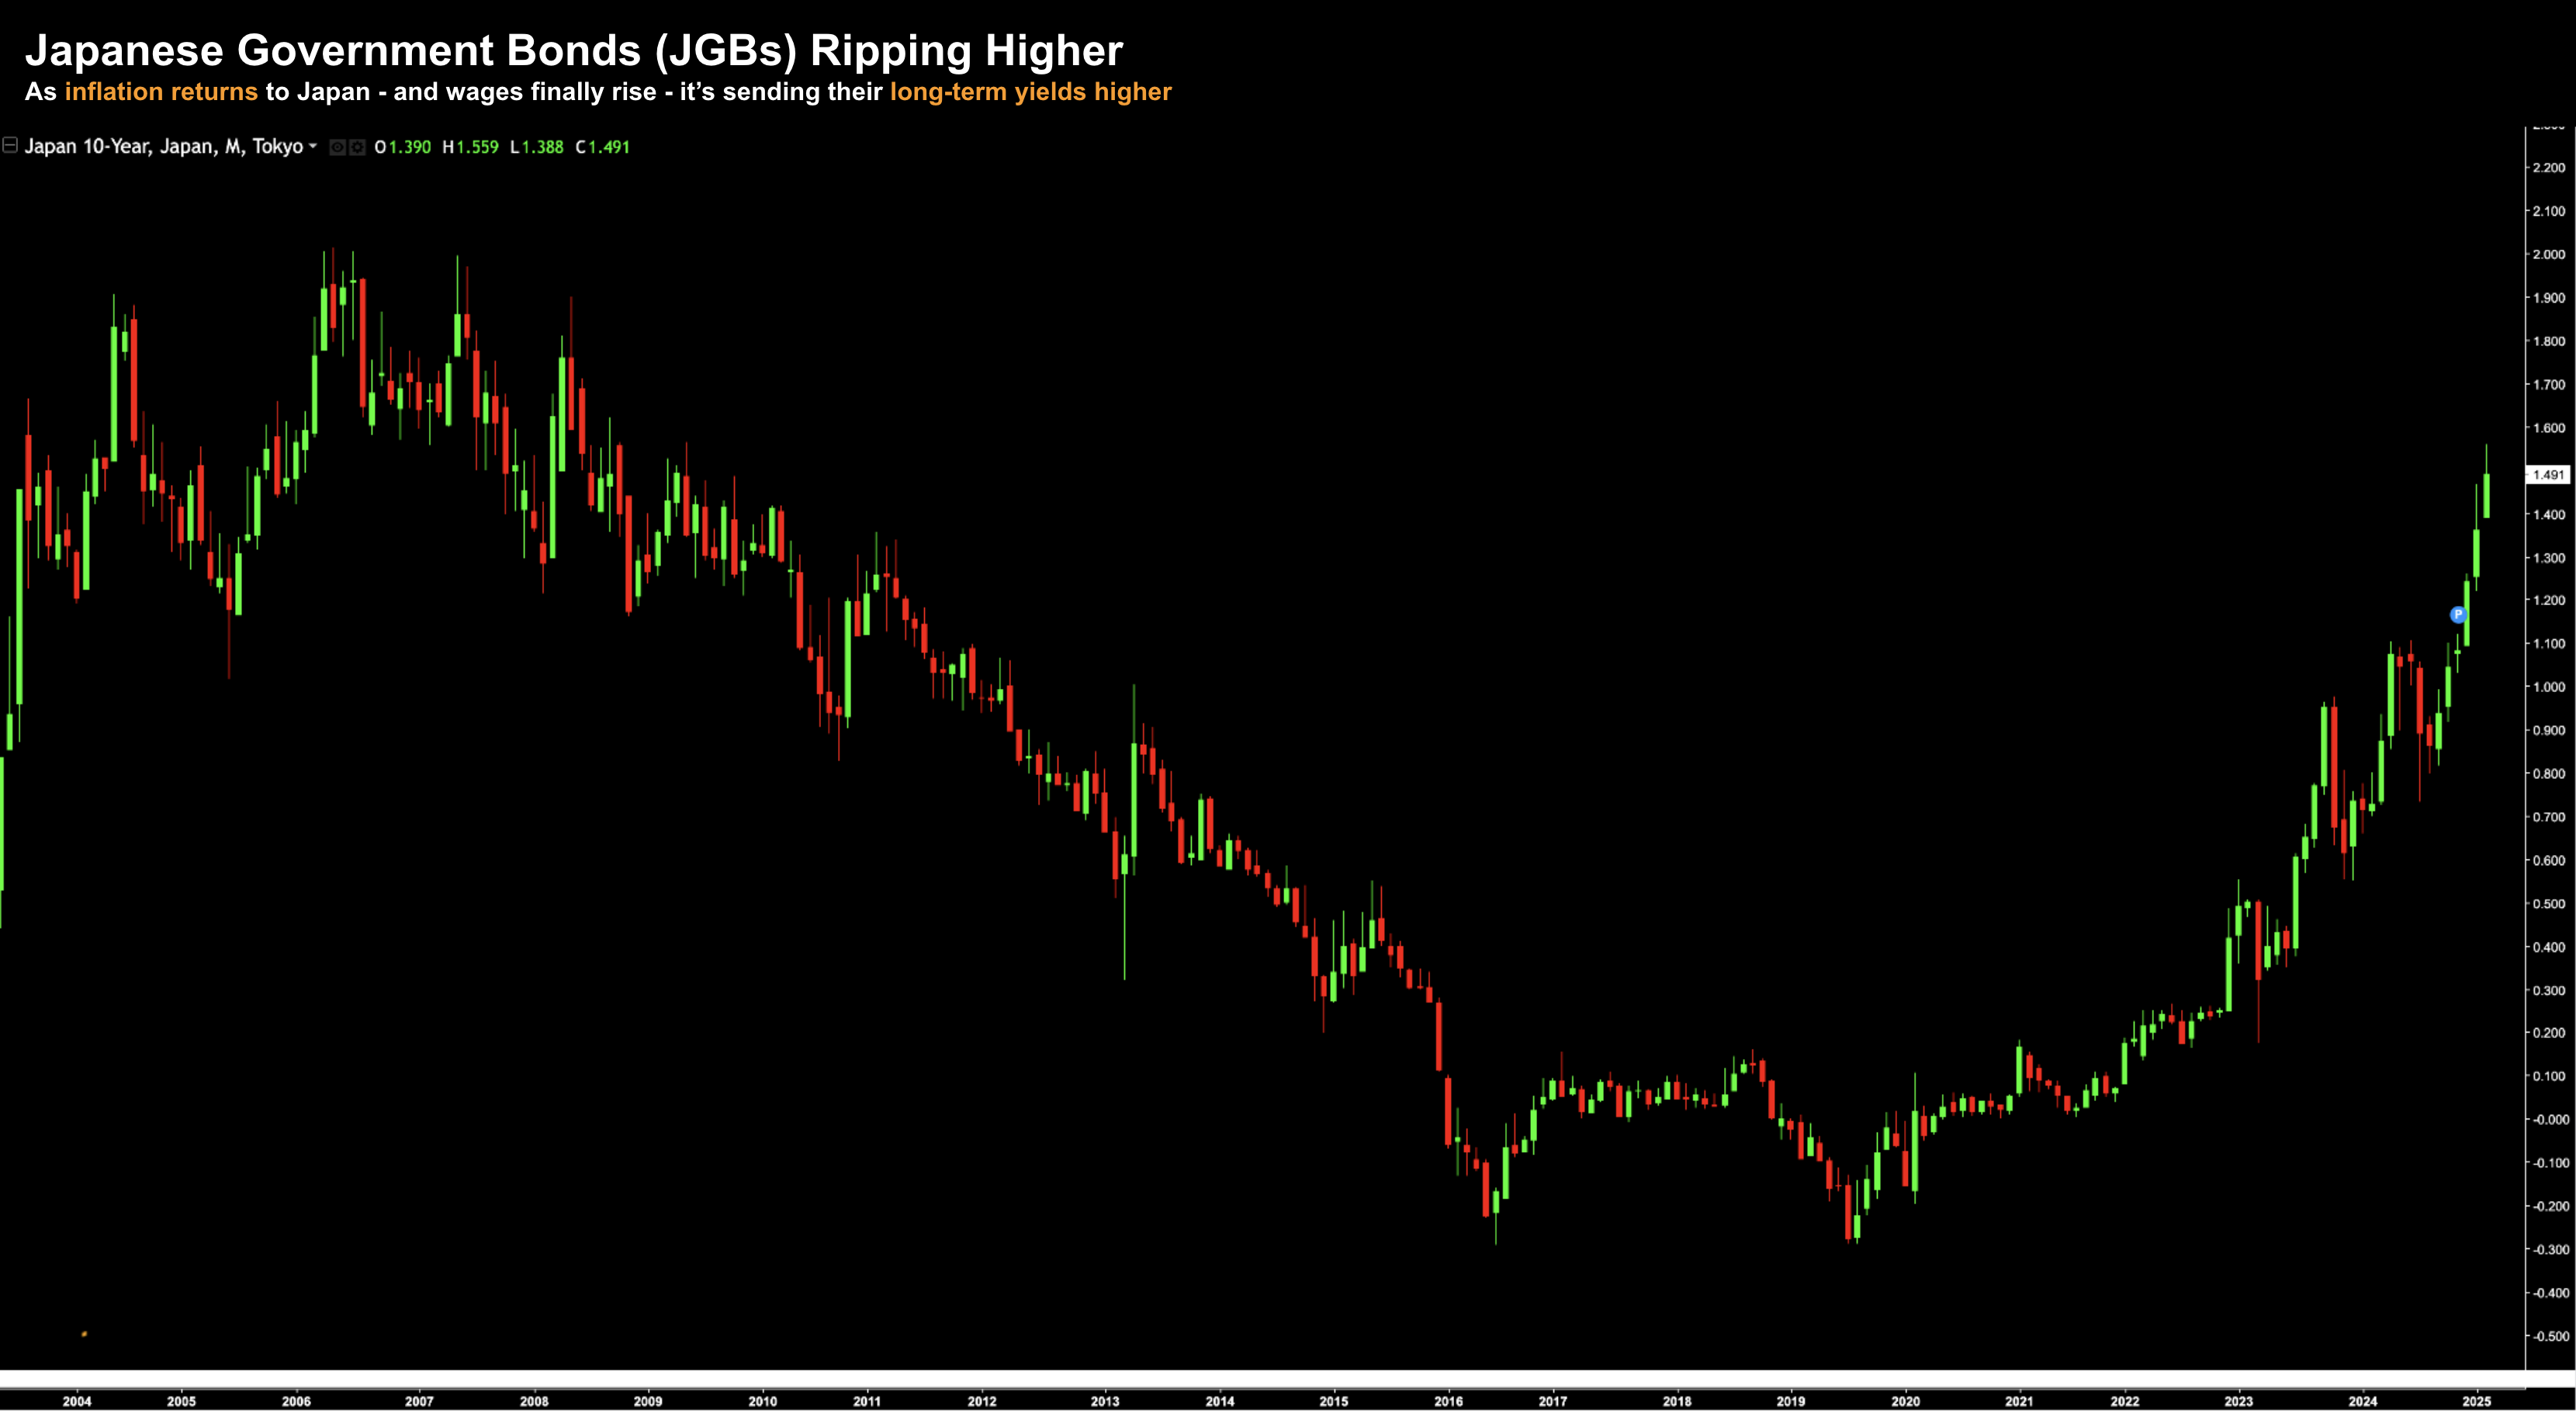
For example, long suffering Japanese workers have had paltry increases for a generation. But over the last two years, the annual shunto—the labor negotiations each spring—has brought the highest pay rises since the slump took hold 35 years ago.
And this is what"s driving JGBs higher… in turn strengthening the yen.
Putting it All Together
There are a lot of moving parts for investors to weigh.
From my lens, it"s not just limited to what comes out of Washington. Yes, tariffs are driving widespread uncertainty (for good reason). They will damage growth and confidence. And they could for several months.
However, when we look across the pond at what we see with the yen, this is clearly having an impact. For what it"s worth, I think the yen strengthens a little more here. For example, we"re not yet at the resistance levels we saw during July/August 2024 (around 140).
In turn, this will likely pressure stocks. Keep a close eye on what we see with both JGBs and the USD/JPY, stick to your checklists, and operate strictly within your circle of competence.