The Freediver Test: How to Spot a False Market Breakout
Words: 1,727 Time: 8 Minutes
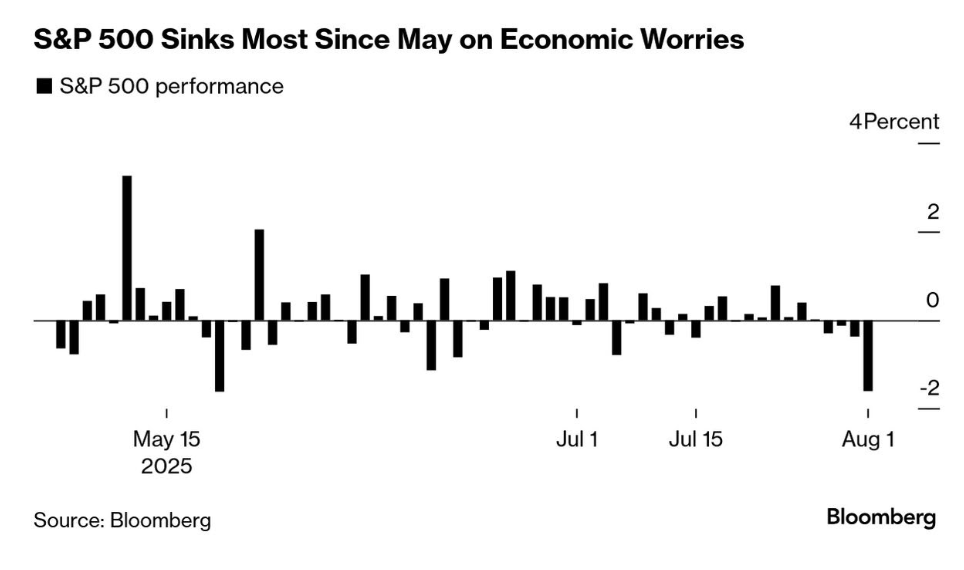
- Stocks stumble on very weak labor data
- We have the "stag" but will we see the "flation"?
- Why I think stocks are poised to pullback 10%+
During the week I asked if the S&P 500 was "ok"?
I drew a parallel to the 2024 documentary "Freediver" – which detailed Alexey Molchanov"s daring attempt to set multiple freediving world records.
However, for any world record to count, Alexey had to indicate he was "ok" when resurfacing through a rigorous test
For example, he would first remove his nose piece; give an "ok" signal with his fingers; and then verbally tell the judges that "he"s ok" (go to the 4:10 mark of this video)
And if the sequence was wrong – the free dive record would not count.
This week the S&P 500 made a record high of 6427 – however I wondered if it could "signal" it was ok?
It closed at 3% off that high at 6238
For me, to signal it"s okay, I want to see four weeks holding a level of 4%+ above the previous 6147 Feb high.
We are not there yet (as I will discuss shortly)
So why did the market "get the bends" this week?
Look no further than the revisions to the employment data for the past two months.
It was the worst revision since the pandemic… which suggests there is underlying weakness in the economy.
Payroll Disaster…
The payrolls data today was nothing short of horrible.
And whilst the headlines will report on the dismal 73,000 jobs added (well below the ~140K job additions expected) – the massive 258,000 negative revisions over May and June is cause for concern.
Here"s Mike Shedlock from Mishtalk.com
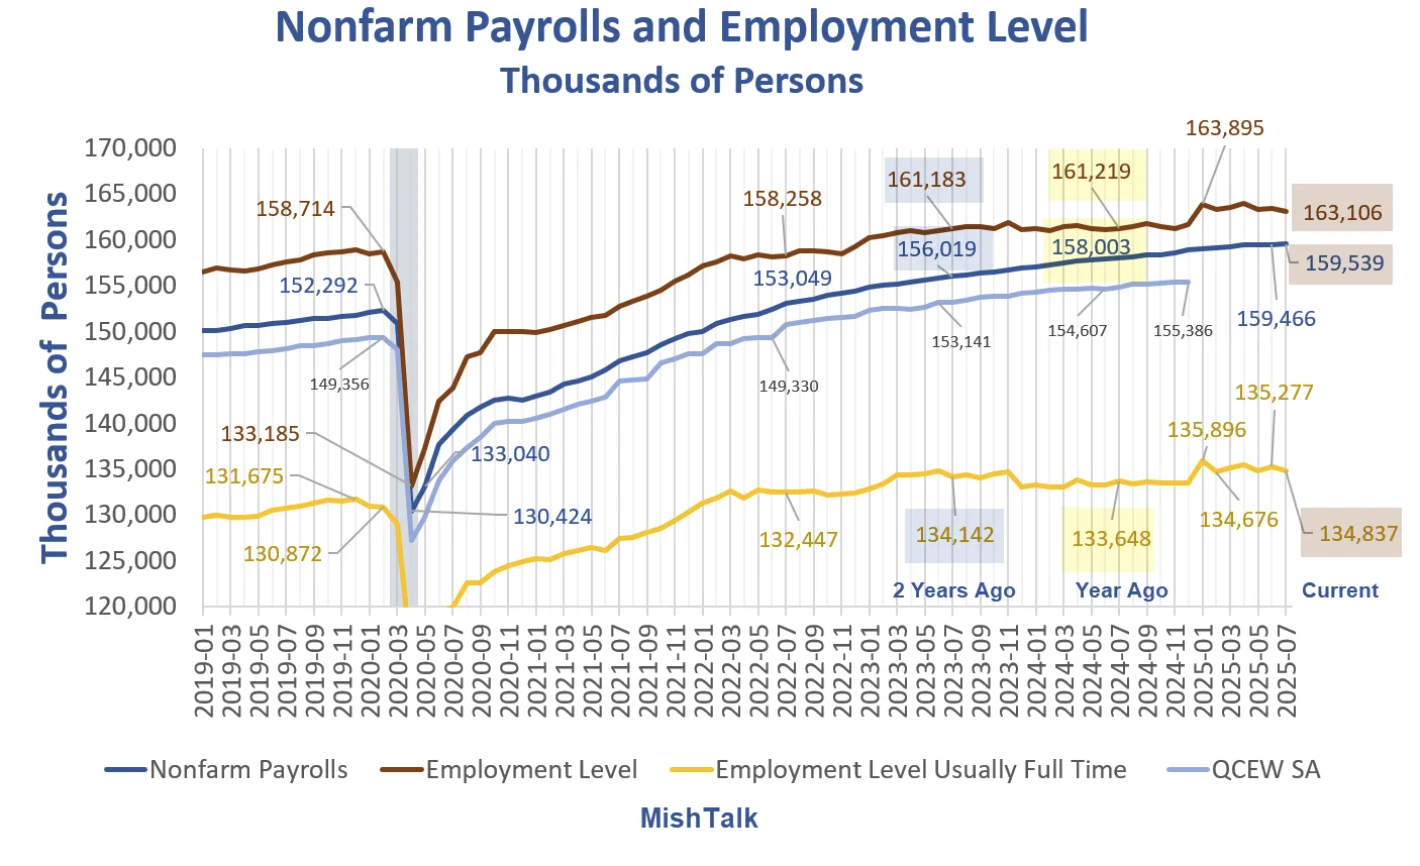
If you want a deep-dive (pun intended!) into the underlying trends with employment – I would highly recommend Mish"s report.
Here are my top 3 takeaways:
- The BLS revised its May and June job reports down by a combined 258,000 jobs — an enormous revision that casts doubt on the reliability of prior labor strength narratives
- In July data, full-time employment fell by 440,000, while part-time work increased by 247,000 — a sign of labor market fragility, underemployment, and possible economic stress
- The Household Survey showed a drop of 260,000 in employment, a rise in unemployment (+221,000), a fall in the labor force, and a climb in the U-6 unemployment rate to 7.9% — indicating more hidden labor market weakness than the headline payroll number suggests.
As an aside, the BLS has a problem with how it reports data.
From mine, any report which is greater than 50% out in any month indicates there"s a problem with how the data is reported. But this is what we find with these labor report surveys.
I say that because its very difficult to plan (and in turn allocate resources) in absence of solid forecasting (government or otherwise).
For those less familiar with how employment is reported – July"s ~77K job additions will be revised twice more before we get a final read. Therefore, one should also take the initial read with a large grain of salt.
However, what"s clear is there is underlying weakness in the labor market. For example:
- Lack of full-time jobs (falling 44K last month) vs part-time additions (+247K).
- The prime age group – 25 to 54 – is down significantly on last year; and
- College educated unemployment rates are rising.
Sure, you will hear various commentators try and rationalize away the negative result by putting it down to less immigration.
From mine, that doesn"t hold water.
The economy is fundamentally cyclical in nature and this is clearly a softening economy (irrespective of the changes we find with immigration levels)
The "Stag" in Stagflation
Fed Chair Powell was reluctant to cut rates at the last meeting largely due to potential risks to inflation from tariffs (which are yet to hit at scale).
However, two members of the Fed dissented on the decision: Chris Waller and Michelle Bowman. From CNBC:
"There is nothing wrong about having different views about how to interpret incoming data and using different economic arguments to predict how tariffs will impact the economy," Waller wrote.
"But, I believe that the wait and see approach is overly cautious, and, in my opinion, does not properly balance the risks to the outlook and could lead to policy falling behind the curve."
Further, Waller insisted that inflation impacts from President Donald Trump"s tariffs have been "small so far" and could continue in that vein.
"With tariff-related price increases likely representing a one-time effect, it is appropriate to look through temporarily elevated inflation readings," said Bowman, who also serves as the Fed"s vice chair for bank supervision.
"I see the risk that a delay in taking action could result in a deterioration in the labor market and a further slowing in economic growth."
Waller (and Bowman) are correct on the "stag" part of stagflation.
Stagflation implies slowing growth coupled with unwanted inflation – an unusual phenomenon. Typically when we have higher inflation we also experience growth.
Now Waller admits that there could be risks to inflation with tariffs. However, he believes the greater risk is the (coming) slowdown in the economy (and subsequent job losses).
As part of this post – I reiterated my preferred (forward looking) economic indicator to monitor consumer spending health is the change in real PCE (Personal Consumption Expenditures) on a quarterly basis year-over-year (e.g. the change YoY for Q2 2025 vs Q2 2024)
The Fed provides us with this data – where consumers have decreased their spending in real terms each quarter this year (red arrows):
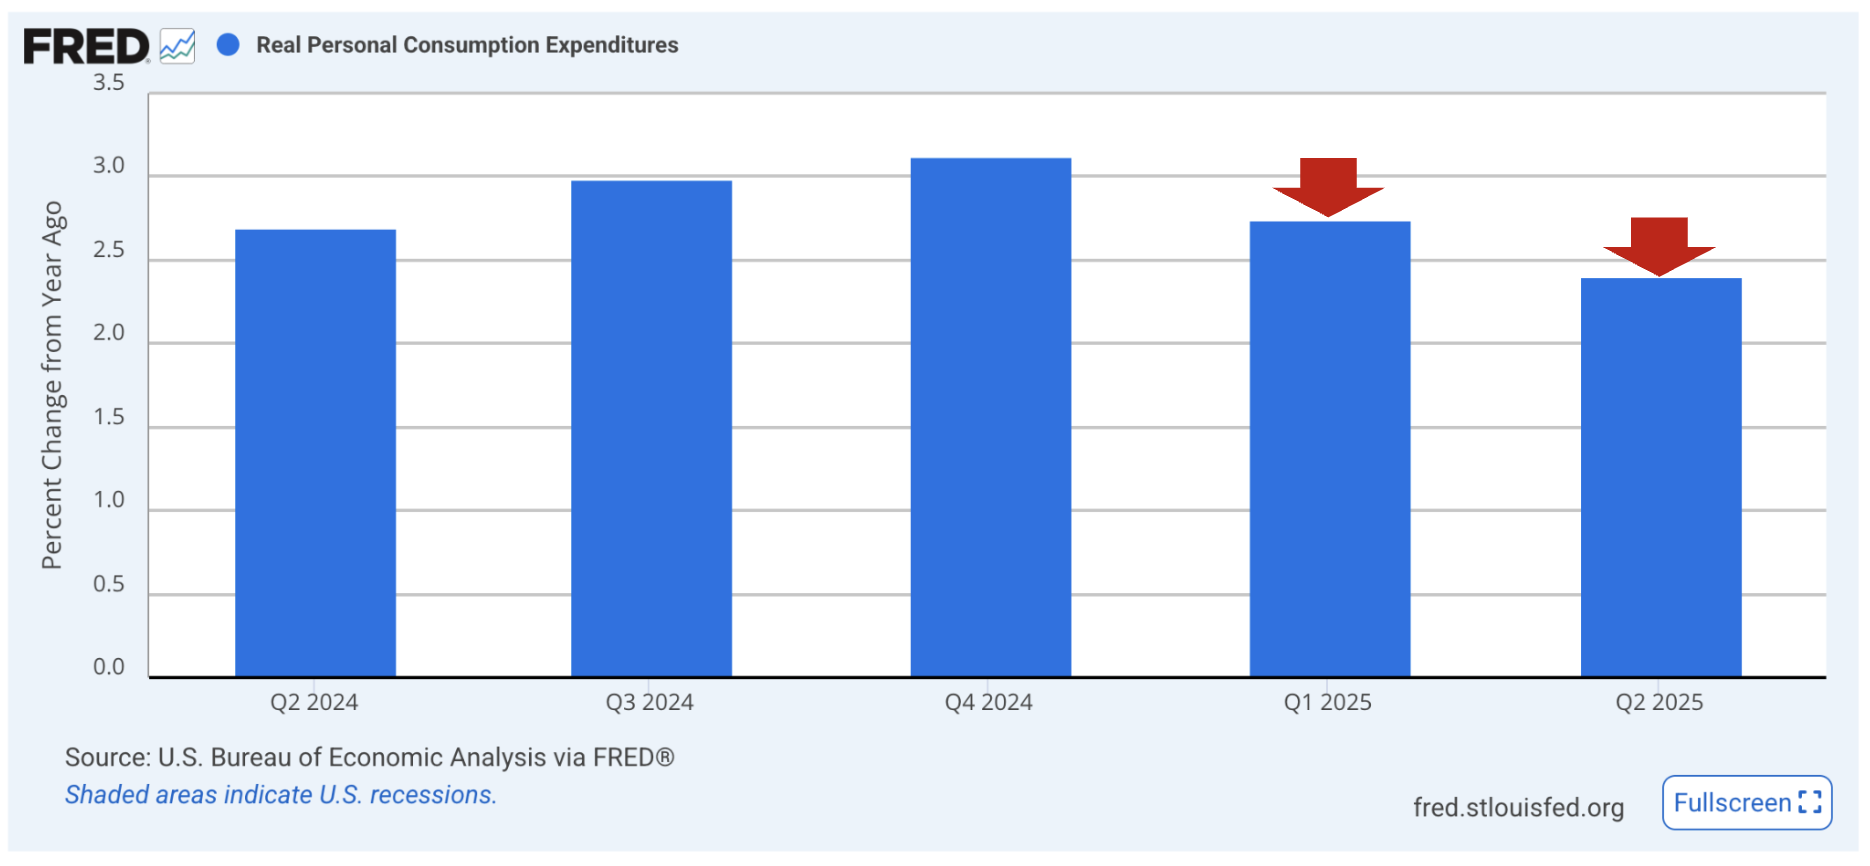
This deserves far more attention than what it receives in mainstream.
For example, my own back-testing has shown that when we experience a drop of more than 2.0% year-over-year in any one quarter – a meaningful correction in the S&P 500 (15% plus) is likely over the following 6-9 months
However, what"s troubling (to me) is the slowdown above is mostly exclusive of the (coming) tariff impact.
From mine, the bulk of the price increases are still to come – given the majority of goods purchases in the first half of the year were exempt from the 15% to 20% tariffs.
Question:
Will US consumers have the capacity to absorb the higher prices which are coming down the pike?
My guess is no.
Again, spending has already slowed in the absence of tariffs. Therefore, I can"t see why it will improve with prices likely to increase.
And whilst some companies will choose to absorb some of the tariff impact through their supply chains (resulting in margin impact and lower profits) – many will try and pass the increase on (assuming they have pricing power).
Put together, with demand slowing and employment weakening – the likelihood of at least one (if not two) rate cuts this year are increasing.
However, if inflation also rises as a result of Trump"s tariffs – this will complicate any decision for the Fed.
The "stag" part is here..
For example, housing, spending and employment data clearly shows that.
What"s unknown is whether the "flation" component is temporary or something more sinister.
S&P 500 Stumbles
For regular readers – there is not much new in the weekly chart.
Things are mostly trading "per the script"; i.e. stocks drifted to an area of (expected) resistance before turning lower. Let"s update the chart:
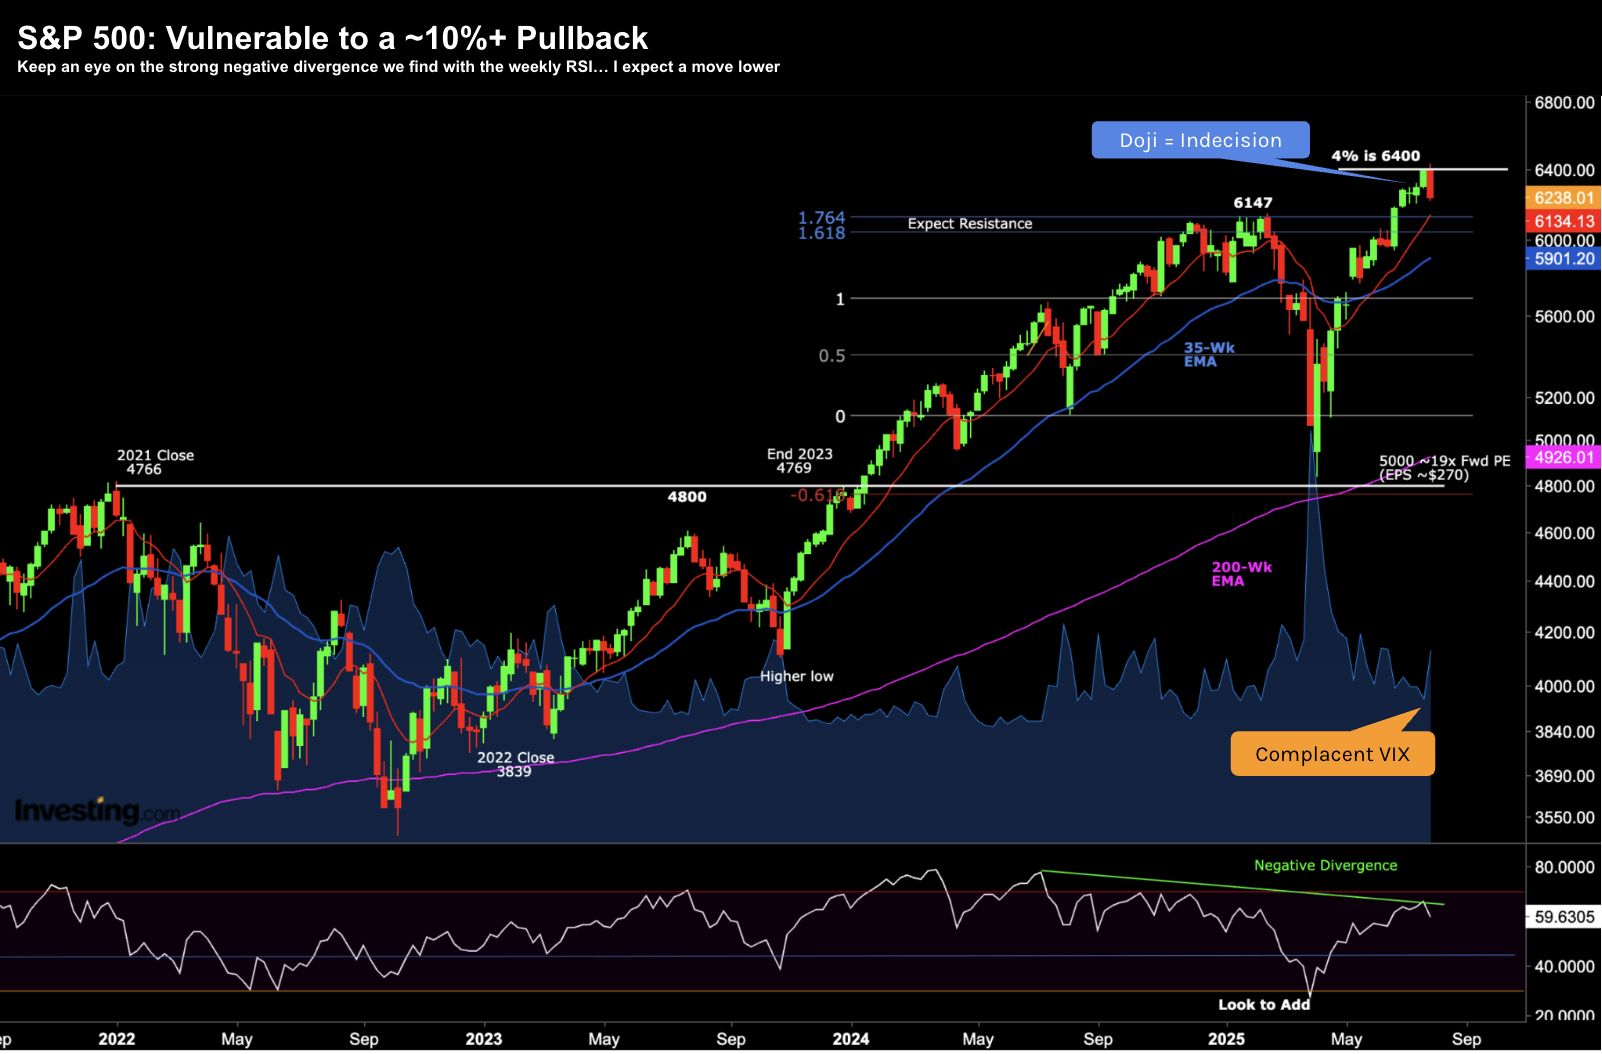
Aug 1 2025
A few weeks ago, I said it would not be surprising to see the market drift higher (e.g., to the tune of 5% or so).
However, I also felt the downside risk was far greater than any upside reward. For example, I felt the upside was limited due to factors such as (not limited to)
- Very high valuations (S&P 500 trading ~22x forward earnings)
- Extreme market concentration risk (due to the AI enthusiasm); and
- Various geopolitical and other macro risks (tariffs etc)
And from a purely technical perspective, we find:
- Consecutive "doji" candles indicating lack of commitment from the bulls;
- Strong negative divergence with the weekly RSI (i.e. fading longer-term momentum); and
- A complacent VIX – trading at levels ~15x (i.e. all traders leaning to one side of the boat)
This week saw the market give back approx four weeks of gains.
That said, a 3% pull back is nothing compared to the extraordinary surge from the April lows.
The ~30% rally from the depths of the April lows (~4800 to ~6300) was extreme – especially when it was not associated with some kind of monetary or fiscal response.
This alone was cause for concern.
I think we are poised to give back a healthy "10%+" of these gains.
My best guess is we will re-test the zone of 5600 to 5800 over the next 2-3 months – however these things are very hard to predict in such a short space of time.
To be clear, I don"t try and trade these kinds of moves (that"s not how I invest).
However, given a move lower is my expectation, I won"t be caught off-balance by adding to (riskier) positions at current (high) valuations.
What"s more, given I"m expecting it, I should have sufficient cash set aside to potentially take advantage if more attractive valuations present (as some did in April)
Putting It All Together
If you"ve enjoyed some stellar gains over the past 4 months – well done.
My own performance record YTD (and rolling 12 months) is shared here.
It would be prudent to lower your exposure with the S&P 500 above 6,000 — looking to add when valuations offer a better longer-term risk reward.
For example, you are better served adding exposure at points "f" and "g" on this chart (vs "d" today)

Consider the rising blue line a forward PE ratio of around 18x (where 18x is the avg forward PE over the past 10 years). If we use the past 100 years – that ratio falls to around 15.5x.
As I mentioned above, today the S&P 500 trades ~22x – well above the longer-term mean).
This assumes the forward EPS will be ~$280 per share (around 12% higher than last year)
For me, a better risk/reward is adding exposure well below 18x.
For example, when the S&P 500 traded closer to 4,800 in April – the forward PE was ~17.3x – a better long-term bet)
In closing, let"s see if the S&P 500 falls back below its Feb high of 6147 (only 1.5% lower).
If it does – then we should consider the price action from June 23 a "false break" of the previous high. These are often reversal signals.
Again, these things are very difficult to predict. For example, no-one knows what markets will do next week; and/or in "one, three, six or twelve month"s" time.
However, what I"m always trying to do is ensure I"m not overly exposed when markets are clearly over-valued (which I believe is the case today)