adriant

adriant

Why ‘Soft Landings’ Deserve Scrutiny

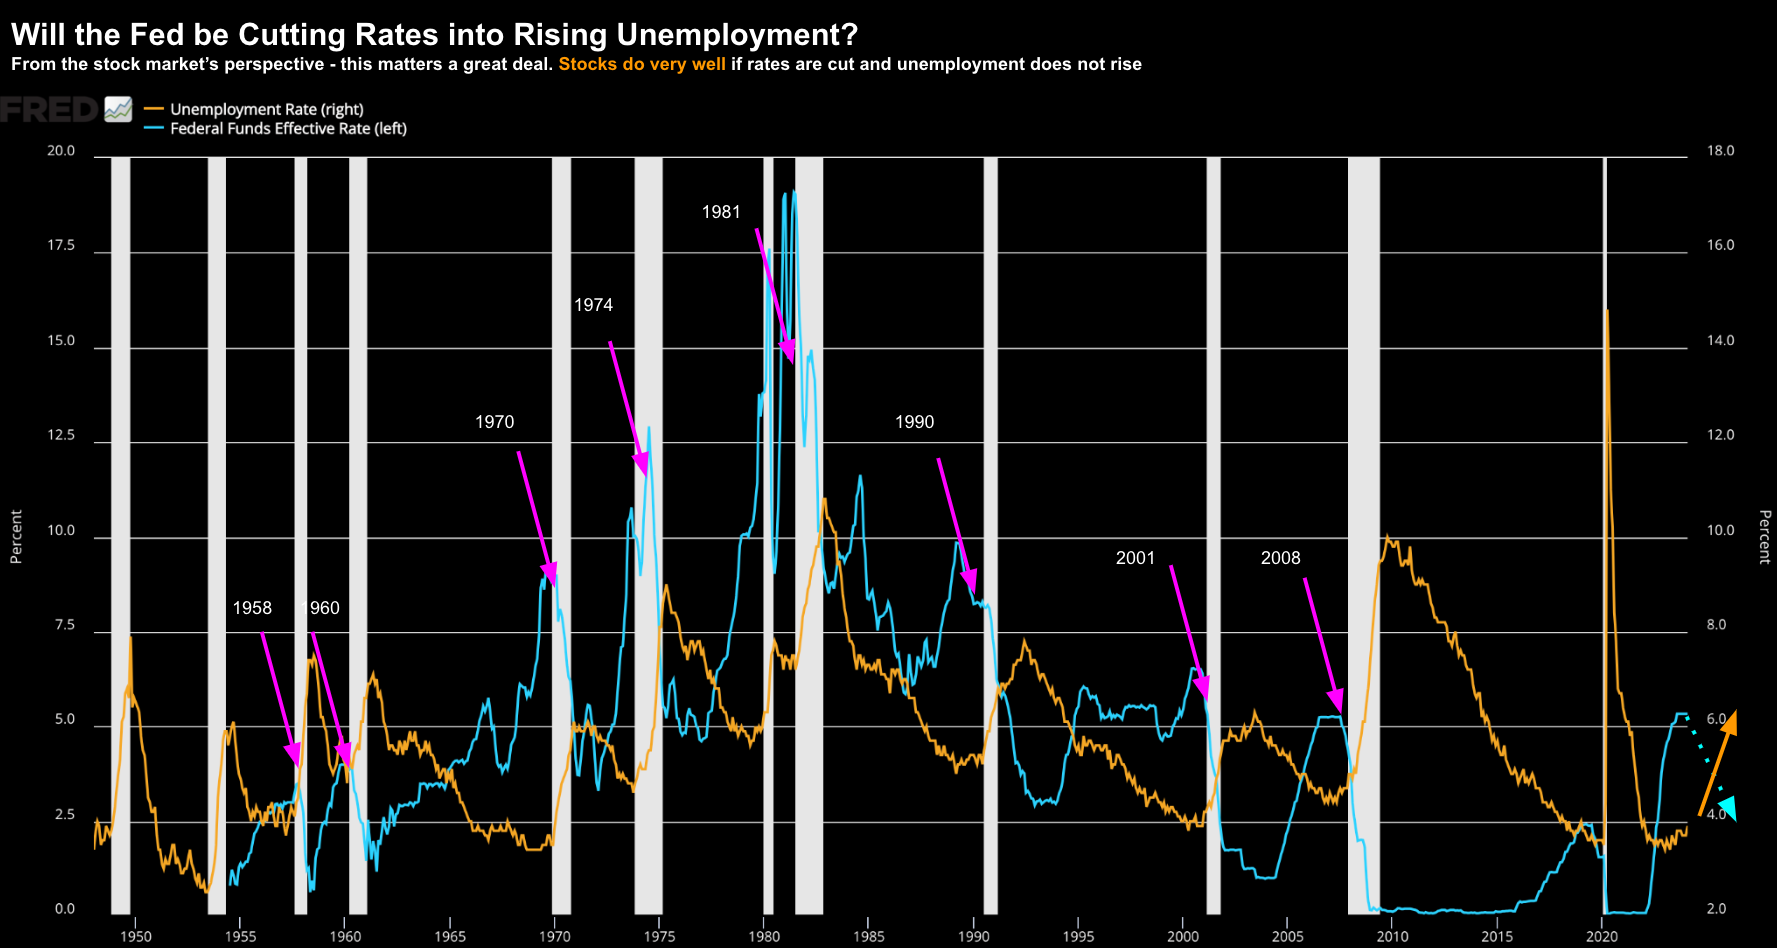
What impact will a 'soft-landing' have on current stock valuations And does there need to be a recession to experience a meaningful (e.g. 12%+) decline? My short answer is no. The gist of this post is to remind investors that you don't need a definitive line-of-sight to a potential recession before protecting gains. I say that because recessions are lagging events - which come at the very end of the cycle. By the time they arrive - the economic damage is already done. Therefore, we need to be in front of the curve. Typically in the 9-months leading up to a recession - stocks continue to trade at or near highs - as analysts raise their outlooks. Unemployment and earnings are usually strong - as GDP keeps its head above zero. But those who are able to understand where we are in the business cycle will pay careful attention to what's happening shortly after peak economic growth.

What Does Kolanovic See That Others Don’t?

Most analyst year-end S&P 500 targets range from 4200 to 5600 for equities; and 3.00% to 4.75% for 10-year yields. My guess is we will land somewhere in between these zones. On the whole, it's fair to suggest Wall Street feels 'comfortable' with holding equities. Consensus year end targets average 5400 - which tells me most don't expect stocks to do much between now and year's end. More important - they don't expect stocks to lose any ground. This post expands what I think is the single most important variable (and risk) with these forecasts: the relative health of the US consumer and their ability to continue spending.

Swoooosh

Is the market overconfident? Does it only see upside? What weight does it assign to the risks? And are the 'sirens' of perpetually higher prices too hard to ignore? One popular measure of confidence is the weekly AAII Investor Sentiment Survey. As at June 26th - 44.5% of all investors lean bullish - up from 39.0% June 5th. Analysts have also been busy hiking their S&P 500 targets for year end - with the average now around 5400. But not all analysts are aligned. Separately, we look at the record 20% one-day decline in Nike... they are warning of sales declines next year. Is this a great long-term (3-year) opportunity; or a signal to stay clear?

Buying is Easy… Selling is Hard

Do you consider yourself a "good" or "bad" investor? For example, one might say a good investor is someone who beats the returns of the Index over a long period (10.5% annualized). Beating the Index over the long-run is difficult to do... very few fund managers are able to do it. But what if I framed the question this way: (i) bad investors think of ways to make money; vs (ii) good investors think of ways not to lose money. Which one best summarizes your approach to speculation? Of the several thousand posts I've written the past 13+ years - this is arguably the most important question you could ask. If you understand the gravity of this distinction... you have a good chance of succeeding.

Divergent Signals

The market is wildly enthusiastic about all things "AI". If you're a company - and you don't have an AI narrative - the market doesn't want to know you. However, I also think this is potentially a blind spot. AI will undoubtedly be important and will change the way we do things (as we effectively re-wire tech) - but it's a tool. For example, whilst Wall Street celebrates that an iPhone might be able to better answer our questions - Main Street sees things very differently. Do you think the majority of consumers understand the optimism on Wall Street? And similarly, do you think Wall Street understands why consumers are complaining?

It’s Fed Week… Market Sees Cuts Coming

Are rates restrictive? And if they are - how do you know? That's the question the Fed will address tomorrow - but it's not easy to answer. For example, on the one hand there's a (large) cohort who believe the Fed are falling 'behind the curve' - therefore increasing the odds of a recession. They feel that growth risks are to the downside - and do not need to wait for both inflation and employment data to confirm what's ahead. On the other side of the coin - there are those who think we still run the risk of higher inflation if acting too early.

Is Momentum Waning? More on Why I’m Bullish Bonds into 2025

As part yesterday's missive - I talked to why I think bond yields are too high. For example, I offered a chart showing the declining trend in nominal GDP growth vs what we see with the US 10-year yield. Economic growth is clearly slowing and yet yields are going the opposite way. Why? Therefore, investors should ask themselves what is the catalyst which will take us back to a 3.0% 'growth' mode (i.e. what we saw over Q3 and Q4 of 2023)? For example, is it the consumer? They make up ~70% of GDP with consumption - however they are mostly tapped out (as we have heard in the latest earnings reports). What will it be?

Rate Cut Hopes for 2024 Start to Fade 

Just as market participants were starting to get hopeful rate cuts could be coming - that door was slammed shut. Yields surged opposite a stronger-than-expected monthly payrolls number. Heading into the print - the market was looking for softness in the labor market - with maybe 190K jobs added. Recent data had suggested jobs were slowing - paving the way for the Fed to cut rates as early as July (with a 70% chance assigned to September). As it turns out, monthly job gains were said to be 272,000. That said, there are some ambiguities with the report - with the unemployment rate jumping to 4.0%. Is Sahm's Rule about to trigger in the coming months?

When the Laws of Probability are Forgotten

Whilst the S&P 500 posted a negative week - it was a strong month for equities. The world's largest Index managed to add 4.8% for the month - hitting an intra-month record high of 5339. That's four of five winning months to start 2024. Perhaps completely enamored by all things AI (more on this in my conclusion) - investors basically shrugged off sharply higher yields and a series of disappointing inflation prints to push prices higher. What could go wrong? At the end of every month - it pays to extend our time horizon to the (less noisy) monthly chart. And whilst the weekly chart is useful - it tends to whip around. Longer-term trends (and perhaps investments) are often better examined using this lens.

Is the Market “Euphoric”?

It's that time of year... where "Sell in May and Go Away" makes its typically annual appearance. Personally I don't give it much weight... basically none. Who invests with the timeframe a few months? Not many that consistently make money. But therein lies the rub - this saying is only relevant as a function of how you choose to invest. Your time horizons are likely very different to mine. This post will offer background where the adage comes from. From there, I will try and answer the question of whether the market is "euphoric". And finally, I'll share some names that I've been adding to.... it's not NVDA.