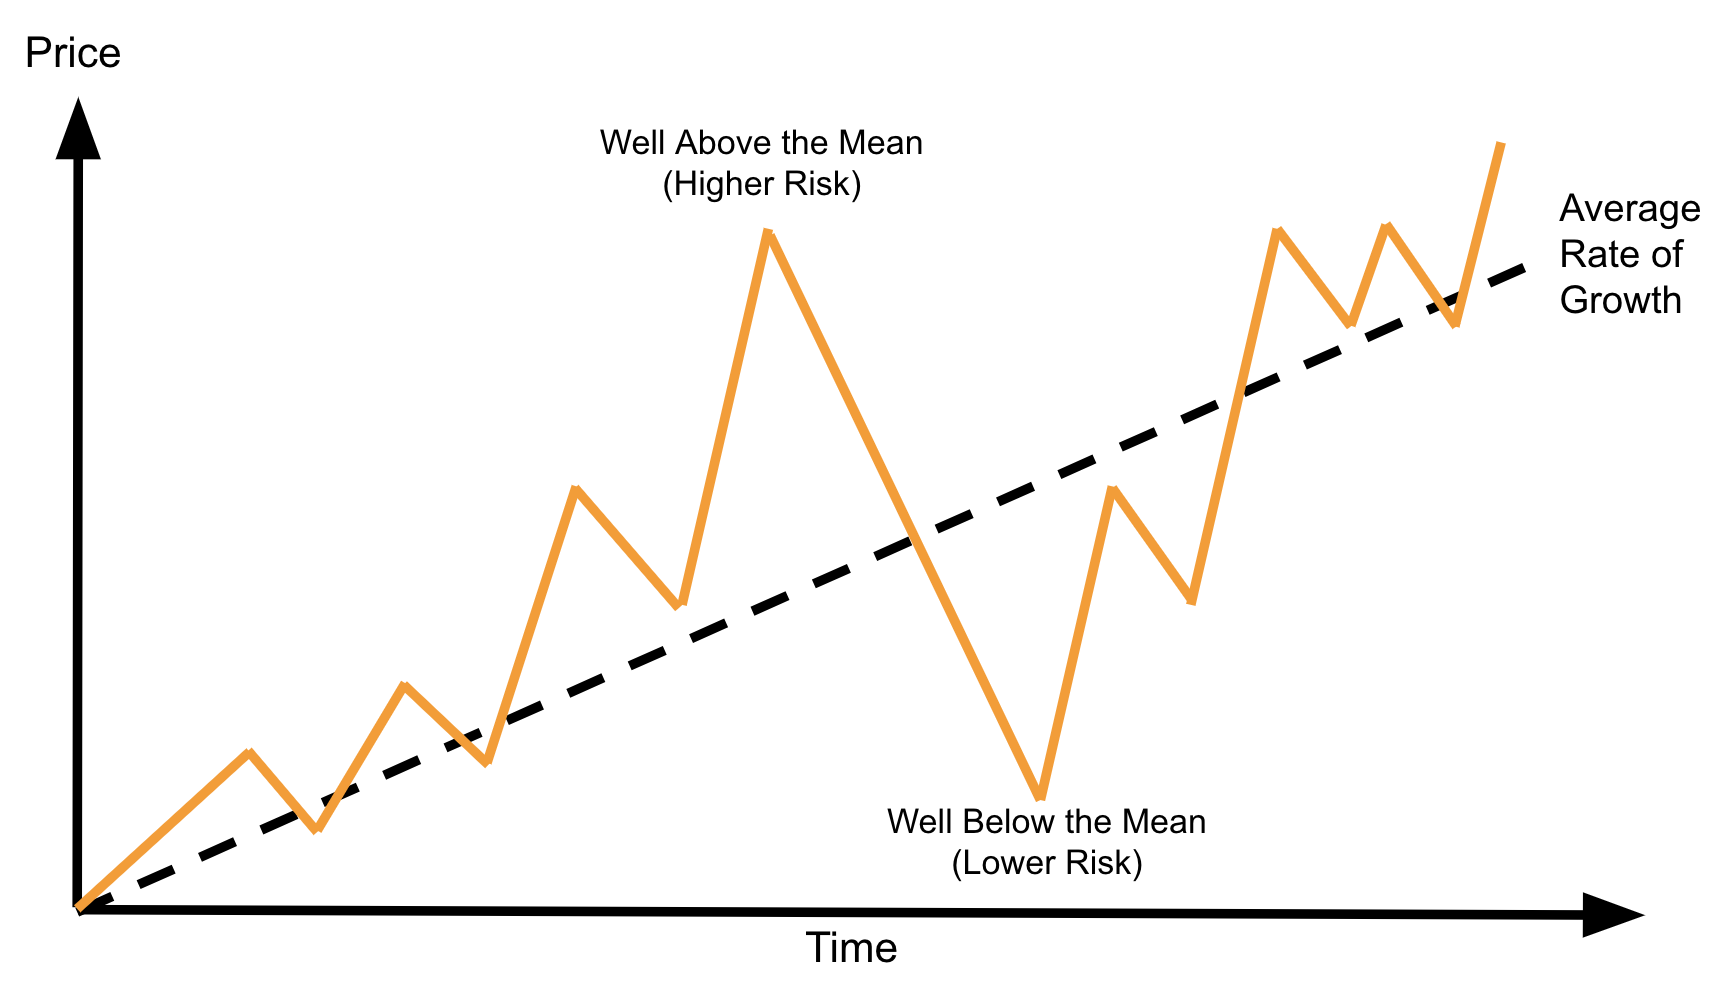
Category S&P500

Things Looking Better – But More to Do

For 23 straight weeks (from late October) - the market has effectively gone straight up. It added ~$12T in market cap with barely a pause - a rally for the ages. Now for ten of those weeks, it was in overbought territory - where the (weekly) Relative Strength Index (RSI) traded above 70. I cautioned readers of a likely (technical) correction. And whilst I stressed the market can remain overbought for several weeks (and it did) - it's also an area to be cautious. This is where sell-offs start. And it seems we could be seeing the start of a 7-10% correction... however it's still early.

S&P 500 +10.1% for Q1 – Can it Continue?

If you asked me at the end of December whether I thought the S&P 500 would be up ~10% at the end of the first quarter this year - I would have said "unlikely". And yet here we are. With the promise of (coming) interest rate cuts and continued strong economic growth (implying growth in earnings) - US equities have arguably exceeded most analysts full year targets. For we have already exceeded all but 1 of 18 full year S&P500 forecasts "experts" made at the beginning of the year.

Don’t Fight the Fed…

"Don't fight the Fed" is a popular Wall St. adage for investors. The phrase was coined by well known investor Marty Zweig in 1970. At the time, Zweig explained the Federal Reserve policy enjoys a strong correlation in determining the stock market’s direction. Fast forward ~50 years and his theory has proven mostly correct.

Money Supply is Expanding: Fuel for Stocks

When the supply of money expands - it's typically very good for stocks. For example, the S&P 500 index is said to appreciate at an average annualized pace of 14.02% when liquidity expands. However, when it contracts, that gain was only around 7.0%. Today money supply is once again expanding after one of the largest contractions in recent history. This has the potential to be very good for investors. As they say, it's always easier swimming with the tide.

Something Doesn’t Add Up… 

It's Nvidia's world and we're living in it (if you believe the stock market). The S&P 500 (and Nvidia) recorded all new highs post the AI chip maker's earnings. Be careful paying too much. The rapid rise in Nvidia's market cap has only seen the market narrow further. And from mine, that makes it more subject to both volatility and risk. Deutsche Bank’s Jim Reid dimensioned the risk another way. He shows how the Top 10% of stocks in the S&P 500 constitute ~75% of the total capitalization. We have not seen that since 1929! The only other time we saw something similar was the dot.com bubble...

Mean Reversion: Index Risks & the ‘M7’

In the game of asset speculation – mean reversion suggests that over time an asset will eventually return to its average price if it drifts or spikes too far from that average level. If applied, it can often help you avoid paying too much. My thinking is the S&P 500 has now drifted too far from the longer-term mean. History has always told us that inevitably prices will mean revert. This post explores the potential risks to investors if simply choosing to passively invest via the benchmark Index. Look no further than the so-called "Mag 7" - which constitute more than a 30% weight.

Three Cheers for 5,000!

This week the S&P 500 closed above 5,000 for the first time. Another milestone as we climb the 'wall of worry'. Over the past 100+ years the S&P 500 has averaged capital gains of ~8.5% per year plus dividends of ~2.0%. That's a total return of close to 10.5% (on average). If you compound 10.5% per year over 20 years (i.e., 'CAGR') - that's a 637% increase. But as we know, the pathway is rarely smooth. Some years the market may "add 20%" and others it could give back a similar margin (or worse). And we saw this happen recently. However over the long run - markets will rise more often than they fall.

Powell Won’t be Bullied

As we started this year - I felt the market was getting ahead of itself. Not only was the tape approaching an overbought zone - it also assumed as many as six rate cuts (possibly seven) before the end of the year. What's more - it also priced in that earnings per share (EPS) would grow 12% year on year. It felt like a contradiction. For e.g., either the economy was reeling and needed (emergency) rate cuts; or the economy is expanding strongly (supporting earnings growth)? Today Fed Chair Jay Powell pushed back on the former. Markets should not expect rate cuts as early as March... stocks didn't like it.

Will Earnings Deliver on the Hype?

Q4 2023 earnings are starting to hit the tape. From mine, if the market is to continue rallying - it's less about inflation and the Fed - it's whether corporate America will deliver on 12% earnings growth in 2024. Coming into earning's season - my view 12% felt ambitious - given the slowing economy and relative health of the consumer. This post talks more to the concentration in the market - the relative influence from NVDA - and why diversification will be key this year.

Weighing Risk(s) More Useful than Forecasting a Number

Around this time of year - a wrath of 'experts' forecast where they believe the S&P 500 will finish the year. For me it serves little purpose. For one, most of the time forecasts are typically wrong (and by a wide margin). Second, as time goes by, more information will come to hand which often changes our view. From there, forecasts should be updated. Third, there are almost always random events which reset the game. What happens to forecasts then? They are typically tossed out the window. With that, let's look at what the market "experts" believe we will see this year - and I will offer my approach.