Category Investing Lessons

INVESTCON 5: Trimming Growth and the Calculus of Value INVESTCON 5: Trimming Growth and the Calculus of Value

INVESTCON 5: Trimming Growth and the Calculus of Value

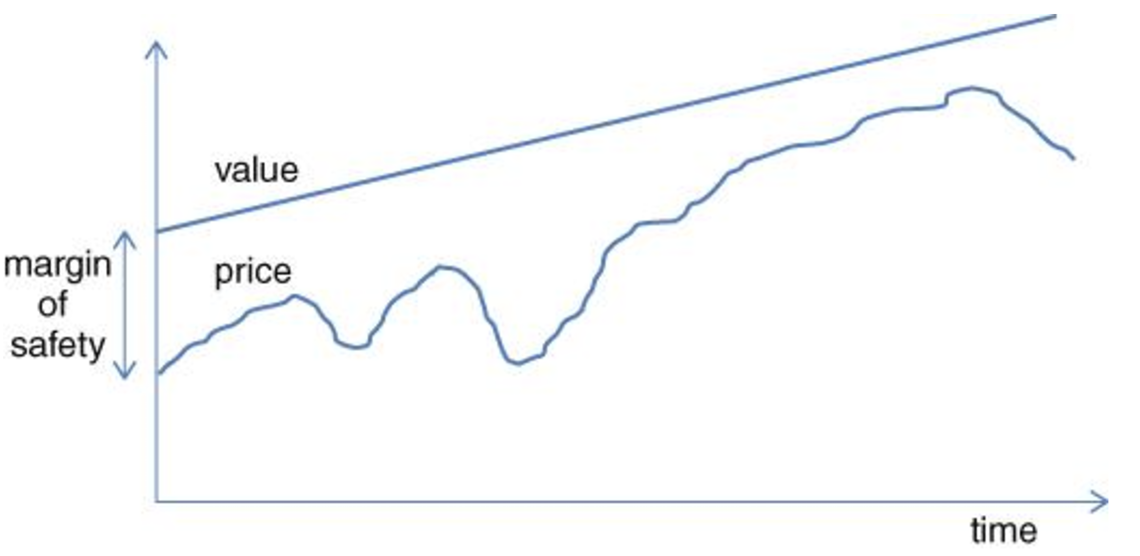
Howard Marks reminds us, true success lies in understanding the critical difference between price and value. Price is what you pay for an asset—a number driven by market sentiment, optimism, and fear. Value, on the other hand, is what you get—an asset's inherent worth based on its ability to generate future cash flows. While markets may act as a voting machine in the short term, pushing prices to extremes, they behave like a weighing machine over the long run, eventually reflecting true value. By focusing on value over price, investors can avoid costly mistakes.

The Patience Paradox: Why ‘Buy and Hold’ Fails at 23x Earnings The Patience Paradox: Why ‘Buy and Hold’ Fails at 23x Earnings

The Patience Paradox: Why ‘Buy and Hold’ Fails at 23x Earnings

Over the past ~40+ years - the S&P 500 Index has returned an average of ~9.3% annually exc. dividends (i.e., 171.6 Jan 1985 to 5,979.5 Jan 2025). If we limit that to the past decade (from 2015) - that avg annual return increases to 11.4% (excluding dividends). But what matters most is (a) the price you pay; and (b) when you get out. Sitting tight for 10 years does not guarantee a 10% return...

Market Volatility vs. True Panic: How to Use the VIX to Identify Peak Fear Market Volatility vs. True Panic: How to Use the VIX to Identify Peak Fear

Market Volatility vs. True Panic: How to Use the VIX to Identify Peak Fear

Are markets panicking? That depends on who you ask. A short-term trader might see the ~6% move lower as significant. On the other hand, those who invest for longer-term (such as myself) see a ~6% move down as nothing at all. From mine, panic isn't here yet. However, there is a measure which can help us identify when markets are overly fearful. And generally - they are great buying opportunities. But we are not there yet.

The Math of Moats: Why ROIC and Free Cash Flow Trump Revenue Growth The Math of Moats: Why ROIC and Free Cash Flow Trump Revenue Growth

The Math of Moats: Why ROIC and Free Cash Flow Trump Revenue Growth

Whilst market's fret about slowing growth ("Ready for a Growth Scare?") - Warren Buffett sits back with a smile. His company - Berkshire Hathaway - rallied to fresh record high this week after the company reported a record high quarterly profit. Its market value is now over $1.1 Trillion. So how did Buffett build this incredible cash machine? I'll outline three (basic) reasons... all of which you can emulate.

The Art of Inaction: Strategic Positioning Beats Market Timing The Art of Inaction: Strategic Positioning Beats Market Timing

The Art of Inaction: Strategic Positioning Beats Market Timing

Saturday Feb 22nd was circled on my calendar. It was the day Warren Buffett shared his annual shareholder letter. If you want to become a better long-term investor - it's worthwhile reading every one of his 59 letters (from 1965). With respect to valuations he offered this: “We are impartial in our choice of equity vehicles, investing in either variety based upon where we can best deploy your (and my family’s) savings. Often, nothing looks compelling; very infrequently we find ourselves 'knee-deep' in opportunities.”

Why Warren Buffett Bought SiriusXM: A Deep Dive into ROIC, Cash Flow, and Value Trap Risks Why Warren Buffett Bought SiriusXM: A Deep Dive into ROIC, Cash Flow, and Value Trap Risks

Why Warren Buffett Bought SiriusXM: A Deep Dive into ROIC, Cash Flow, and Value Trap Risks

Recently Warren Buffett increased his stake in SiriusXM (SIRI) to over 32% of all available stock. However, with the company losing subscribers - where revenue and earnings in decline - why would the Oracle of Omaha increase his ownership? Two reasons: (a) first its return on invested capital and free cash flow; and (b) the value offered. This post explains both the quality and value arguments for Buffett choosing to increase his exposure to this unloved stock...

How to Identify High-Quality Stocks: A Simple Framework for Quality, Value, and ROIC How to Identify High-Quality Stocks: A Simple Framework for Quality, Value, and ROIC

How to Identify High-Quality Stocks: A Simple Framework for Quality, Value, and ROIC

Charlie Munger once joked "all I want to know is where I’m going to die, so I’ll never go there.” Jokes aside - it's the same approach you should apply with investing. And it's not difficult to do. The math is very simple -- addition, subtraction, division and multiplication. If you have access to a calculator - you're all set. The challenge is mastering your emotions (and any self-defeating behaviors). A calculator (or AI) can't help you with that. This game is more EQ than it is IQ. Think of it as a test of your character versus your intellect. For e.g. - many highly intelligent people get investing wrong (e.g., due to emotions such as greed, fear or some inherent bias). This post talks about how we can simplify our approach to avoid taking excessive risks

Investing with Inversion: How to Avoid Costly Market Mistakes and Master the Mental Game

Charlie Munger once said "it is remarkable how much long-term advantage people like us have gotten by trying to be consistently not stupid, instead of trying to be very intelligent". There's a lot of wisdom to be gained in that quote. Now getting things wrong can be a good teacher if you're willing to learn from the experience. However they can also be very expensive. With respect to investing - our primary goal should be to eliminate (or meaningfully reduce) the possibility of making large costly mistakes. A large mistake can reduce our investable capital - impacting our returns for years to come. So how do we try to make fewer mistakes? There are two ways....

Margin of Safety: Why Valuation Guardrails Matter in Euphoric Markets Margin of Safety: Why Valuation Guardrails Matter in Euphoric Markets

Margin of Safety: Why Valuation Guardrails Matter in Euphoric Markets

It would not surprise me to see 2025 repeat the drawdowns we saw in 2022. And we could see 10-15% lower in the first half. For example, during Q4 2021 - I warned of excessive valuations (specifically in tech). That was timely. However, it's different this time. 10-year yields are now above 4.70%. And should they continue their march towards 5.0% - valuations (and earnings) will be challenged. That said, Wall St. "experts" are assuming significant earnings growth for next year (evidenced by the average 6,600 2025 target at an expected 25x forward multiple). They're adopting a "lottery ticket" mentality - where the majority of investors naively expect extraordinary returns with little regard for downside risks.

2025 – Finding Quality at Reasonable Prices

The S&P 500 recorded a 23.3% gain for 2024. For the first time since 1998 - posted two consecutive years of gains above 20%. Not bad right? Well if we extend our time horizon to include 2022 - the market's CAGR is just 7.2% (below its long-term average of ~8.0% exc dividends) Mmm. Not as good. And over 5 years - the S&P 500 CAGR is is 12.7%; and over 10 years its 12.4%. It's important we measure results over a period of at least 5 years (preferably 10). 2-3 years is a very short amount of time... where all kinds of distortions will happen. But over time - these distortions are always corrected. My point? Things always mean revert... and one should never 'cherry pick' dates to fit a narrative.